CFD Trading
Stocks
ETFs
Trading Platforms
Payment Methods
Fraudulent websites posing to have a connection with JFD
Please be aware of fraudulent websites
posing as JFD's affiliates and/or counterparties

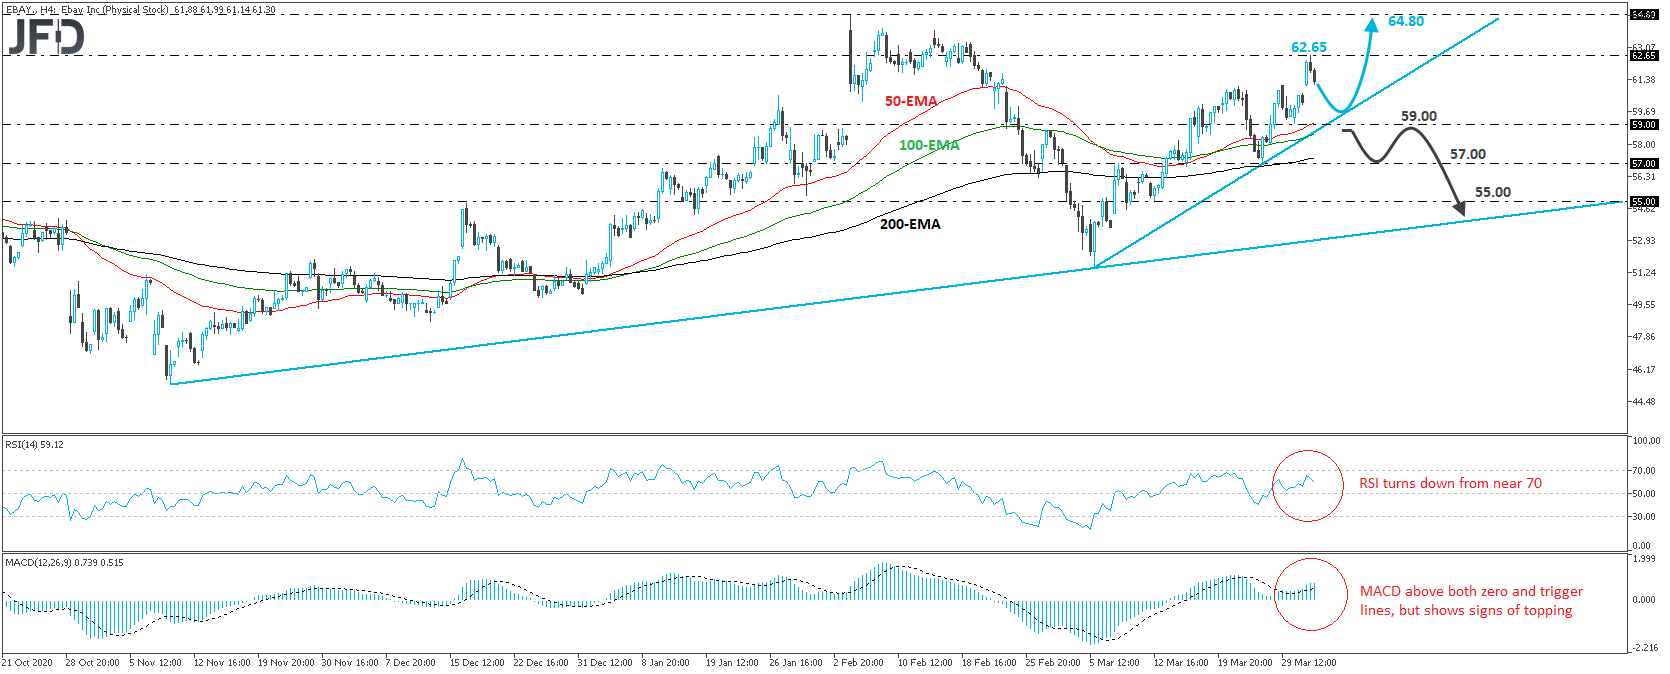
The eBay Inc. (NASDAQ: EBAY) stock traded north on Tuesday, after hitting support at 59.00. On Wednesday, it opened with a positive gap, but hit resistance at 62.65 and then, it retreated somewhat. Overall, the stock continues to print higher peaks and higher troughs above the upside support line drawn from the low of March 5th, and thus, we would consider the short-term outlook to still be positive.
The current retreat may continue for a while more, but investors may find interest in the stock near the pre-mentioned upside line. If so, we could see a rebound back near the 62.65 territory, the break of which may extend the recovery towards the 64.80 zone, which is the stock’s all-time high, and was hit on February 4th.
Shifting attention to our short-term oscillators, we see that the RSI turned down after hitting resistance slightly below 70, while the MACD, although above both its zero and trigger lines, shows signs of topping as well. Both indicators detect slowing upside speed and support the case for some further retreat before the next leg higher, at lest until the short-term upside line.
Now, in order to start examining the case of a larger correction, we would like to see a dip below that upside line, as well as below Tuesday’s low of 59.00. This may trigger declines towards the low of March 25th, at 57.00, the break of which may extend the slide towards the 55.00 zone, or slightly lower, near another upside support line, taken from the low of November 10th.
Disclaimer:
The content we produce does not constitute investment advice or investment recommendation (should not be considered as such) and does not in any way constitute an invitation to acquire any financial instrument or product. The Group of Companies of JFD, its affiliates, agents, directors, officers or employees are not liable for any damages that may be caused by individual comments or statements by JFD analysts and assumes no liability with respect to the completeness and correctness of the content presented. The investor is solely responsible for the risk of his investment decisions. Accordingly, you should seek, if you consider appropriate, relevant independent professional advice on the investment considered. The analyses and comments presented do not include any consideration of your personal investment objectives, financial circumstances or needs. The content has not been prepared in accordance with the legal requirements for financial analyses and must therefore be viewed by the reader as marketing information. JFD prohibits the duplication or publication without explicit approval.
There are risks involved with trading of cash equities. Past performance is not indicative of future results. You should consider whether you can tolerate such losses before trading. Please read the full Risk Disclosure.
Copyright 2021 JFD Group Ltd.

 Marcus Klebe
 Marcus Klebe
 Marcus Klebe
 Marcus Klebe
 Marcus Klebe
 JFD Research
 JFD Research
 Marcus Klebe
 Marcus Klebe
 Marcus Klebe
Fraudulent websites posing to have a connection with JFD
Please be informed that, the below listed websites fraudulently misrepresent to have a connection with JFD and have infringed with JFD’s rights and trademarks in order to defraud users of their personal data, registration data and funds.
Unfortunately, JFD cannot guarantee that the list is exhaustive or always up-to-date and refers only to the websites that were brought to our attention. Therefore, if an investor is in doubt about the connection of any website with JFD, or spots a website that is substantially similar in design, structure and content to JFD’s website, please contact us at support@jfdbrokers.com and we will take all necessary actions to report it and protect other investors from being defrauded.
For your further reference and the avoidance of any doubts, feel free to check the full list of JFD’s web domains approved by CySEC.

