CFD Trading
Stocks
ETFs
Trading Platforms
Payment Methods
Fraudulent websites posing to have a connection with JFD
Please be aware of fraudulent websites
posing as JFD's affiliates and/or counterparties

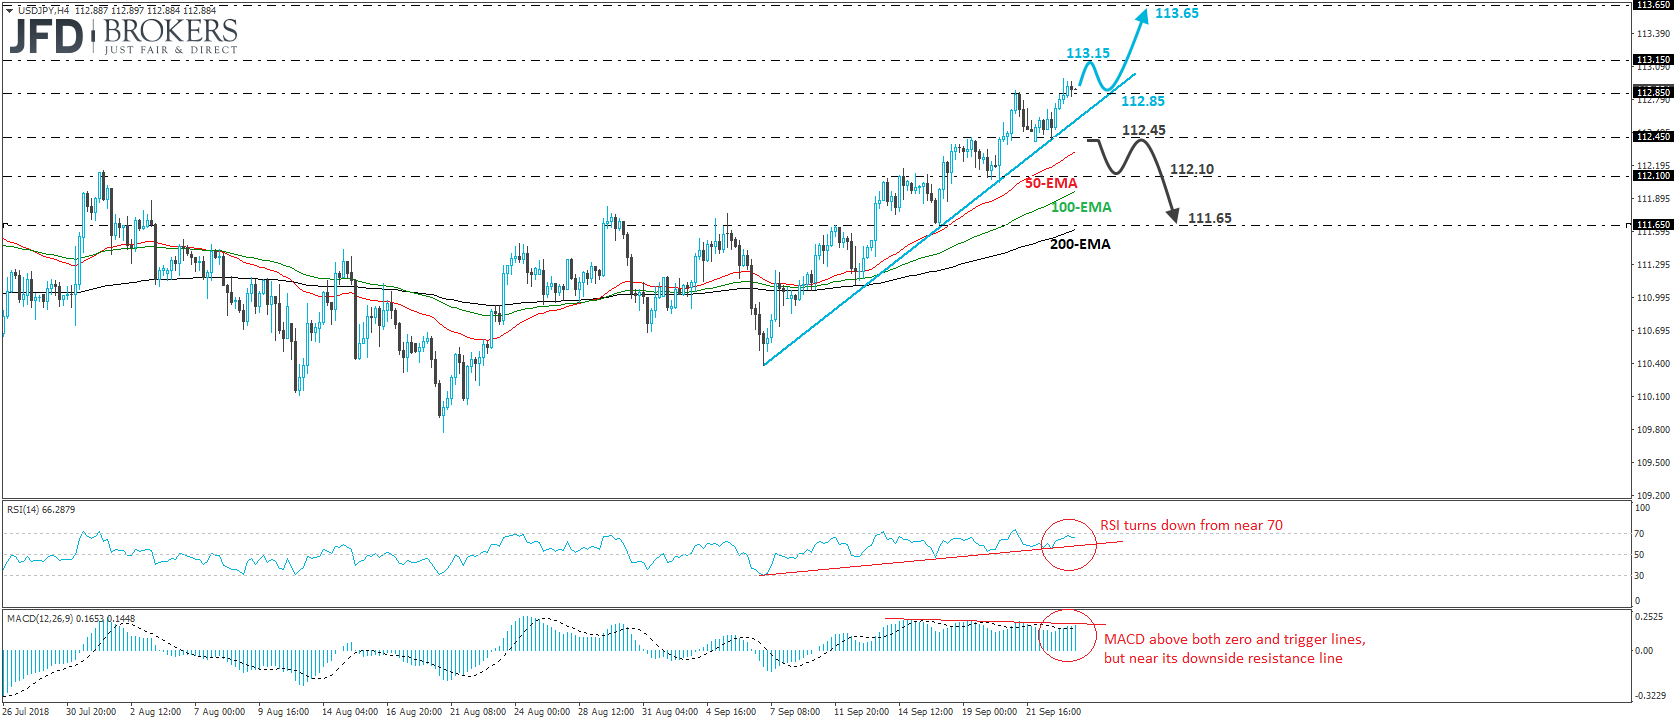
USD/JPY traded higher yesterday, and during the Asian morning Tuesday, it emerged above the resistance (now turned into support) barrier of 112.85, marked by the peak of the 21st of September. The pair continues to print higher peaks and higher troughs above the uptrend line drawn from the low of the 7th of September and thus, we would consider the short-term outlook to be positive for now.
We believe that the break above 112.85 may have opened the path towards the 113.15 hurdle, defined by the peaks of the 18th and 19th of July. Another break above that resistance may set the stage for larger bullish extensions, perhaps towards the 113.65 territory, marked by the high of the 21st of December.
Taking a look at our short-term oscillators, we see that the RSI rebounded from its respective upside support line but hit resistance near 70 and turned down. The MACD lies above both its zero and trigger lines but shows signs of slowing down near its own downside resistance line. Thus, although both indicators detect positive momentum, we would stay cautious of a possible setback, perhaps after the rate challenges the 113.15 level, or even from current levels, for a test near the uptrend line.
In order to abandon the bullish case and start examining whether the short-term trend has reversed to the downside, we would like to see a clear dip below 112.45. Something like that would confirm a forthcoming lower low on the 4-hour chart and is possible to initially aim for the 112.10 support zone. Another break below 112.10 could encourage the bears to drive the battle towards the 111.65 obstacle, defined by the low of the 18th of September.
Disclaimer:
The content we produce does not constitute investment advice or investment recommendation (should not be considered as such) and does not in any way constitute an invitation to acquire any financial instrument or product. JFD Brokers, its affiliates, agents, directors, officers or employees are not liable for any damages that may be caused by individual comments or statements by JFD Brokers analysts and assumes no liability with respect to the completeness and correctness of the content presented. The investor is solely responsible for the risk of his investment decisions. Accordingly, you should seek, if you consider appropriate, relevant independent professional advice on the investment considered. The analyzes and comments presented do not include any consideration of your personal investment objectives, financial circumstances or needs. The content has not been prepared in accordance with the legal requirements for financial analyzes and must therefore be viewed by the reader as marketing information. JFD Brokers prohibits the duplication or publication without explicit approval.
CFDs are complex instruments and come with a high risk of losing money rapidly due to leverage. 75% of retail investor accounts lose money when trading CFDs with the Company. You should consider whether you understand how CFDs work and whether you can afford to take the high risk of losing your money. Please read the full Risk Disclosure.

 Marcus Klebe
 Marcus Klebe
 Marcus Klebe
 Marcus Klebe
 Marcus Klebe
 JFD Research
 JFD Research
 Marcus Klebe
 Marcus Klebe
 Marcus Klebe
Fraudulent websites posing to have a connection with JFD
Please be informed that, the below listed websites fraudulently misrepresent to have a connection with JFD and have infringed with JFD’s rights and trademarks in order to defraud users of their personal data, registration data and funds.
Unfortunately, JFD cannot guarantee that the list is exhaustive or always up-to-date and refers only to the websites that were brought to our attention. Therefore, if an investor is in doubt about the connection of any website with JFD, or spots a website that is substantially similar in design, structure and content to JFD’s website, please contact us at support@jfdbrokers.com and we will take all necessary actions to report it and protect other investors from being defrauded.
For your further reference and the avoidance of any doubts, feel free to check the full list of JFD’s web domains approved by CySEC.

