CFD Trading
Stocks
ETFs
Trading Platforms
Payment Methods
Fraudulent websites posing to have a connection with JFD
Please be aware of fraudulent websites
posing as JFD's affiliates and/or counterparties

Investors’ morale was dented yesterday on fears that a second coronavirus wave may be looming. Most equity indices slid, while the dollar gained. As for today, market participants may pay extra attention to the US CPIs for April. Tonight, during the Asian morning Wednesday, the RBNZ decides on monetary policy and the question is whether officials will decide to expand their QE program, or not.
The dollar traded higher against all the other G10 currencies on Friday, Monday, and during the Asian morning Tuesday. It gained the most versus NOK, AUD and SEK in that order, while it eked out the least gains versus CHF.
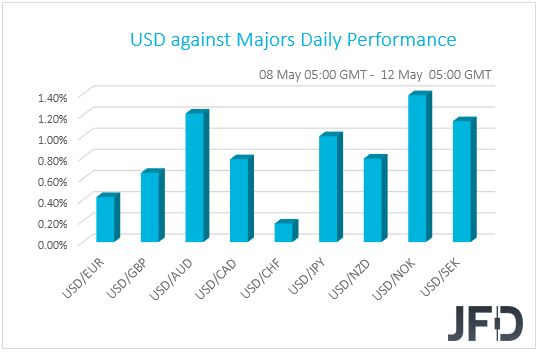
The relative strength of the US dollar and the Swiss franc, combined with the weakening of the Aussie and Kiwi, suggests that market sentiment was subdued. That said, the fact that the Japanese yen was the fourth loser in line points otherwise. Thus, we prefer to turn our gaze to the equity world in order to get a better picture with regards to the broader investor morale.
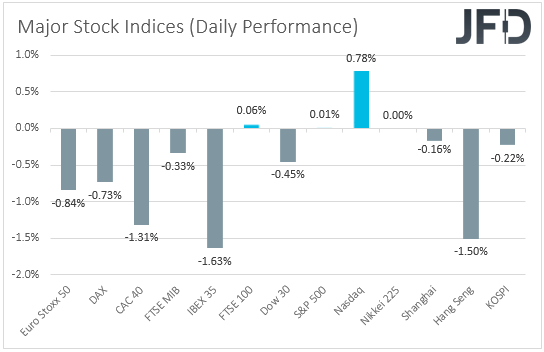
There, most major EU indices traded in negative waters, while later, Wall Street traded mixed. The Dow Jones Industrial Average slid 0.45%, but Nasdaq gained 0.78%. The S&P 500 closed virtually unchanged. Investors’ appetite deteriorated again during the Asian morning today. Although Japan’s Nikkei closed virtually unchanged, at the time of writing, China’s Shanghai Composite, Hong Kong’s Hang Seng and South Korea’s KOSPI are down 0.16%, 1.50% and 0.22% respectively.
What hurt the broader market sentiment may have been news that Germany and South Korea reported an acceleration in new coronavirus infections, which may have raised concerns over a second wave of exponential spreading. Fresh tensions between China and the US may have also dented sentiment. Early in the day reports suggested that the US was preparing to issue a warning that China is working to steal US research on coronavirus vaccines, while during the Asian morning today, following reports that China was considering renegotiating the Phase 1 trade deal, US President Trump said that he doesn’t want something like that.
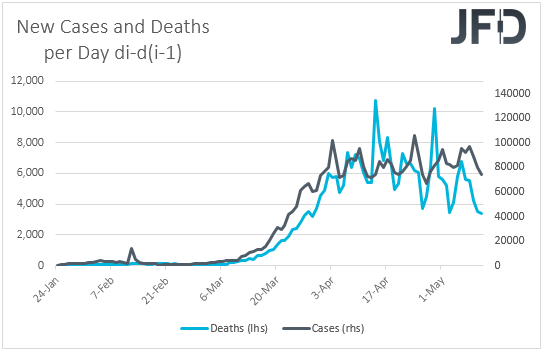
As for our own view, despite the acceleration in Germany’s and South Korea’s infections, the cases on a global scale have been in a slowdown mode, and barring any further negative headlines surrounding the US-China trade front, we would expect risk appetite to rebound again in the following days, if not today. In other words, we expect equities to drift north again and safe havens to come under renewed selling interest.
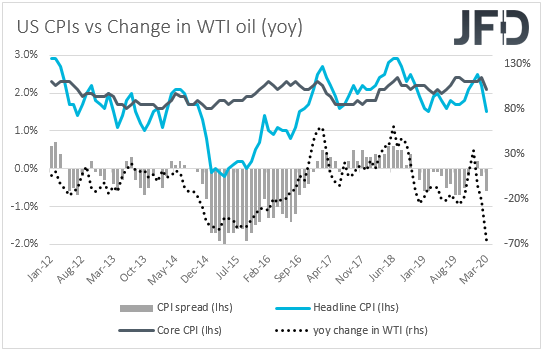
That said, today, market participants may pay extra attention to the US CPIs for April. Headline inflation is expected to have slowed to +0.4% yoy from +1.5%, while the core rate is forecast to have declined to +1.7% from +2.1%. Although this suggests that the fall in the headline rate may be mainly owed to the collapse in oil prices, a core rate below the Fed’s objective of 2% could keep the door open for further easing by the Fed.
Last week, the yields of the Fed funds futures turned negative, suggesting that some investors believed that the Fed could make the exception and cut interest rates into negative waters. However, yesterday, Atlanta Fed President Raphael Bostic and Chicago Fed President Charles Evans said that they don’t anticipate such a move, something that pushed the negative yields back to near zero. Thus, it remains to be seen whether slowing inflation will revive speculation for such an action, despite the Fed never been in favor of the “negative rates” regime.
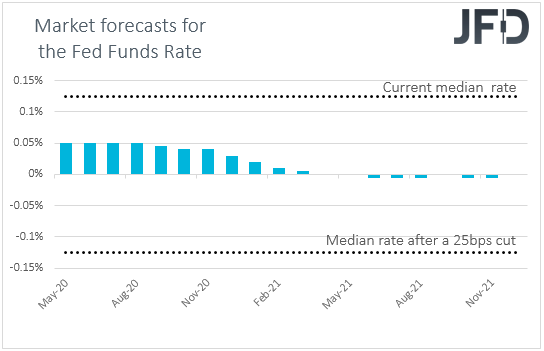
The big question is how the market will react on a possible inflation slowdown. Will equities come under selling interest, or will they rise on expectations of more stimulus? We believe that the latter is more likely as the global stimulus efforts from the monetary and fiscal fronts worldwide, alongside the easing of the “stay at home” measures, and the prospect of a vaccine being ready for distribution soon, have been the drivers of the latest recovery in sentiment.
Yesterday, the S&P 500 came close to testing its April high, at 2973, but eventually reversed back down by the end of the day and closed the trading session virtually unchanged. On the positive side, the index managed to stay above a short-term tentative upside support line drawn from the low of May 4th. As long as that line remains intact, the bulls have a chance to push the price higher in the near term. However, we will take a cautiously-bullish approach for now, because we prefer to see a break above the April’s high, in order to get comfortable with higher areas.
A rise above the April’s high, at 2973, would confirm a forthcoming higher high and more buyers could join in. The S&P 500 could then get lifted to the 3038 zone, which is the high of March 6th. The index could even stall there for a while. That said, if the buyers are still feeling quite comfortable, this may result in a further price acceleration, possibly bringing the S&P 500 to the 3138 level, marked by the highest point of March.
Alternatively, a break of both the aforementioned short-term upside line and yesterday’s low, at 2897, could spook the buyers from the arena temporarily. The index might then slide all the way to the 2831 obstacle, a break of which may set the stage for a re-test of the current lowest point May, at 2780. That area may temporarily halt any further declines.
![]()
As for tonight, during the Asian session Wednesday, we have a central bank deciding on monetary policy and this is the RBNZ. A couple of weeks ago, the Kiwi came under strong selling pressure after Westpac said it expects the RBNZ to cut interest rates to -0.5% in November, a move that could be telegraphed as early as in August. They also said that they expect officials to double their QE program to NZD 60bn at this gathering.
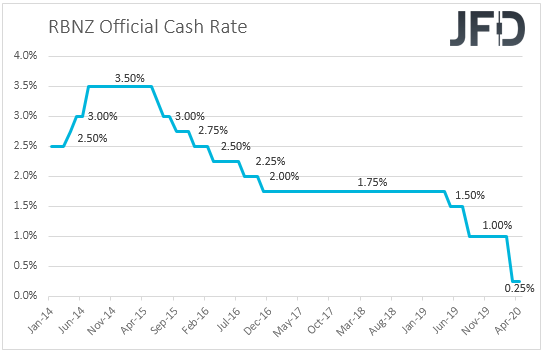
That said, last week, the employment data for Q1 came in better than expected. The unemployment rate ticked up to 4.1% from 4.0%, while the forecast was for a rise to 4.3%. The employment change showed a 0.7% gain in jobs instead of a 0.3% decline as the forecast suggested. This may have alleviated some pressure for policymakers to act again as soon as at this gathering, but it still remains to be seen whether they will decide to double their QE purchases or not. In case they do, the Kiwi is likely to come under renewed selling interest and could even underperform its Australian counterpart, due to monetary policy divergence. Remember that last week, the RBA kept interest rates unchanged but announced that it has scaled back the size and frequency of its own bond purchases.
After finding good support near the 1.7620 hurdle yesterday, EUR/NZD got pushed to the upside again. The pair climbed all the way to the 1.7855 barrier and the slowed down a bit. Around there, the rate also tested a 50 EMA on our 4-hour chart, which continues to provide a bit of resistance. Looking at our oscillators, although the RSI is currently on the flat side and balancing near 50, the MACD lies above its trigger line, pushing higher, despite sitting below zero still. For now, we will take a somewhat bullish approach and aim for slightly higher areas in the near term, because let’s not forget that overall, the pair remains below a tentative downside resistance line taken from the high of April 1st.
A push above yesterday’s high, at 1.7855, may attract a few extra bulls into the field, as such a move would confirm a forthcoming higher high. That’s when EUR/NZD may travel to the 1.7944 hurdle, which is marked by an intraday swing high of May 6th. If that zone is still no match for the buyers, its break could open the door for a move to the psychological 1.8000 territory, or even the 1.8040 level, marked by an intraday swing low of May 4th. Slightly above it runs the aforementioned downside line, which may provide additional resistance.
On the other hand, if the rate falls back below the 1.7757 hurdle, which is an intraday swing low of yesterday, this may place EUR/NZD under some selling pressure again. The pair could end up drifting towards the 1.7684 obstacle, a break of which might clear the path to the current lowest point of May, at 1.7620.
![]()
In the US, besides the CPIs, we have four more Fed officials are scheduled to speak. Those are St. Louis President James Bullard, Minneapolis President Neel Kashkari, Philadelphia President Patrick Harker, and Board Governor Randal Quarles. We will pay extra attention to these speeches as it would be interesting to hear those officials’ opinions on negative interest rates.
With regards to the energy market, we get the API (American Petroleum Institute) weekly report on crude oil inventories, but as it is always the case, no forecast is available.
As for tonight, during the Asian morning Wednesday, apart from the RBNZ decision, we also have Australia’s wage price index for Q1. Expectations are for wages to have grown by 0.5% qoq, the same pace as in Q4, something that would take the yoy rate a tick lower, to +2.1% from +2.2%. In our view, a downtick in the yoy rate is unlikely to prompt RBA policymakers to scale up their QE purchases, although they noted they could do so if deemed necessary. With the spreading of the coronavirus leveling off, they may continue to scale back their program if data continues to allow so.
Disclaimer:
The content we produce does not constitute investment advice or investment recommendation (should not be considered as such) and does not in any way constitute an invitation to acquire any financial instrument or product. The Group of Companies of JFD, its affiliates, agents, directors, officers or employees are not liable for any damages that may be caused by individual comments or statements by JFD analysts and assumes no liability with respect to the completeness and correctness of the content presented. The investor is solely responsible for the risk of his investment decisions. Accordingly, you should seek, if you consider appropriate, relevant independent professional advice on the investment considered. The analyses and comments presented do not include any consideration of your personal investment objectives, financial circumstances or needs. The content has not been prepared in accordance with the legal requirements for financial analyses and must therefore be viewed by the reader as marketing information. JFD prohibits the duplication or publication without explicit approval.
CFDs are complex instruments and come with a high risk of losing money rapidly due to leverage. 83% of retail investor accounts lose money when trading CFDs with the Company. You should consider whether you understand how CFDs work and whether you can afford to take the high risk of losing your money. Please read the full Risk Disclosure.
Copyright 2020 JFD Group Ltd.

 Marcus Klebe
 Marcus Klebe
 Marcus Klebe
 Marcus Klebe
 Marcus Klebe
 JFD Research
 JFD Research
 Marcus Klebe
 Marcus Klebe
 Marcus Klebe
Fraudulent websites posing to have a connection with JFD
Please be informed that, the below listed websites fraudulently misrepresent to have a connection with JFD and have infringed with JFD’s rights and trademarks in order to defraud users of their personal data, registration data and funds.
Unfortunately, JFD cannot guarantee that the list is exhaustive or always up-to-date and refers only to the websites that were brought to our attention. Therefore, if an investor is in doubt about the connection of any website with JFD, or spots a website that is substantially similar in design, structure and content to JFD’s website, please contact us at support@jfdbrokers.com and we will take all necessary actions to report it and protect other investors from being defrauded.
For your further reference and the avoidance of any doubts, feel free to check the full list of JFD’s web domains approved by CySEC.

