Fraudulent websites posing to have a connection with JFD
Please be aware of fraudulent websites
posing as JFD's affiliates and/or counterparties

United Airlines Stock Losing Attractiveness
Yesterday, the United Airlines Holdings Inc (NASDAQ: UAL) reported its earnings, where it showed a loss of around 1.3 billion USD from the start of the year. The company continues to suffer from the issues surrounding the pandemic. Although consumers are eager to travel again, various government restrictions make these journeys not as easy as they should be, which puts off most of the travellers from purchasing tickets. Also, with an improvement in the remote-working conditions, business travel is becoming less relevant. Unless the governments around the world start allowing free travel again, the airline industry could remain under a lot of negative pressure for a while more.
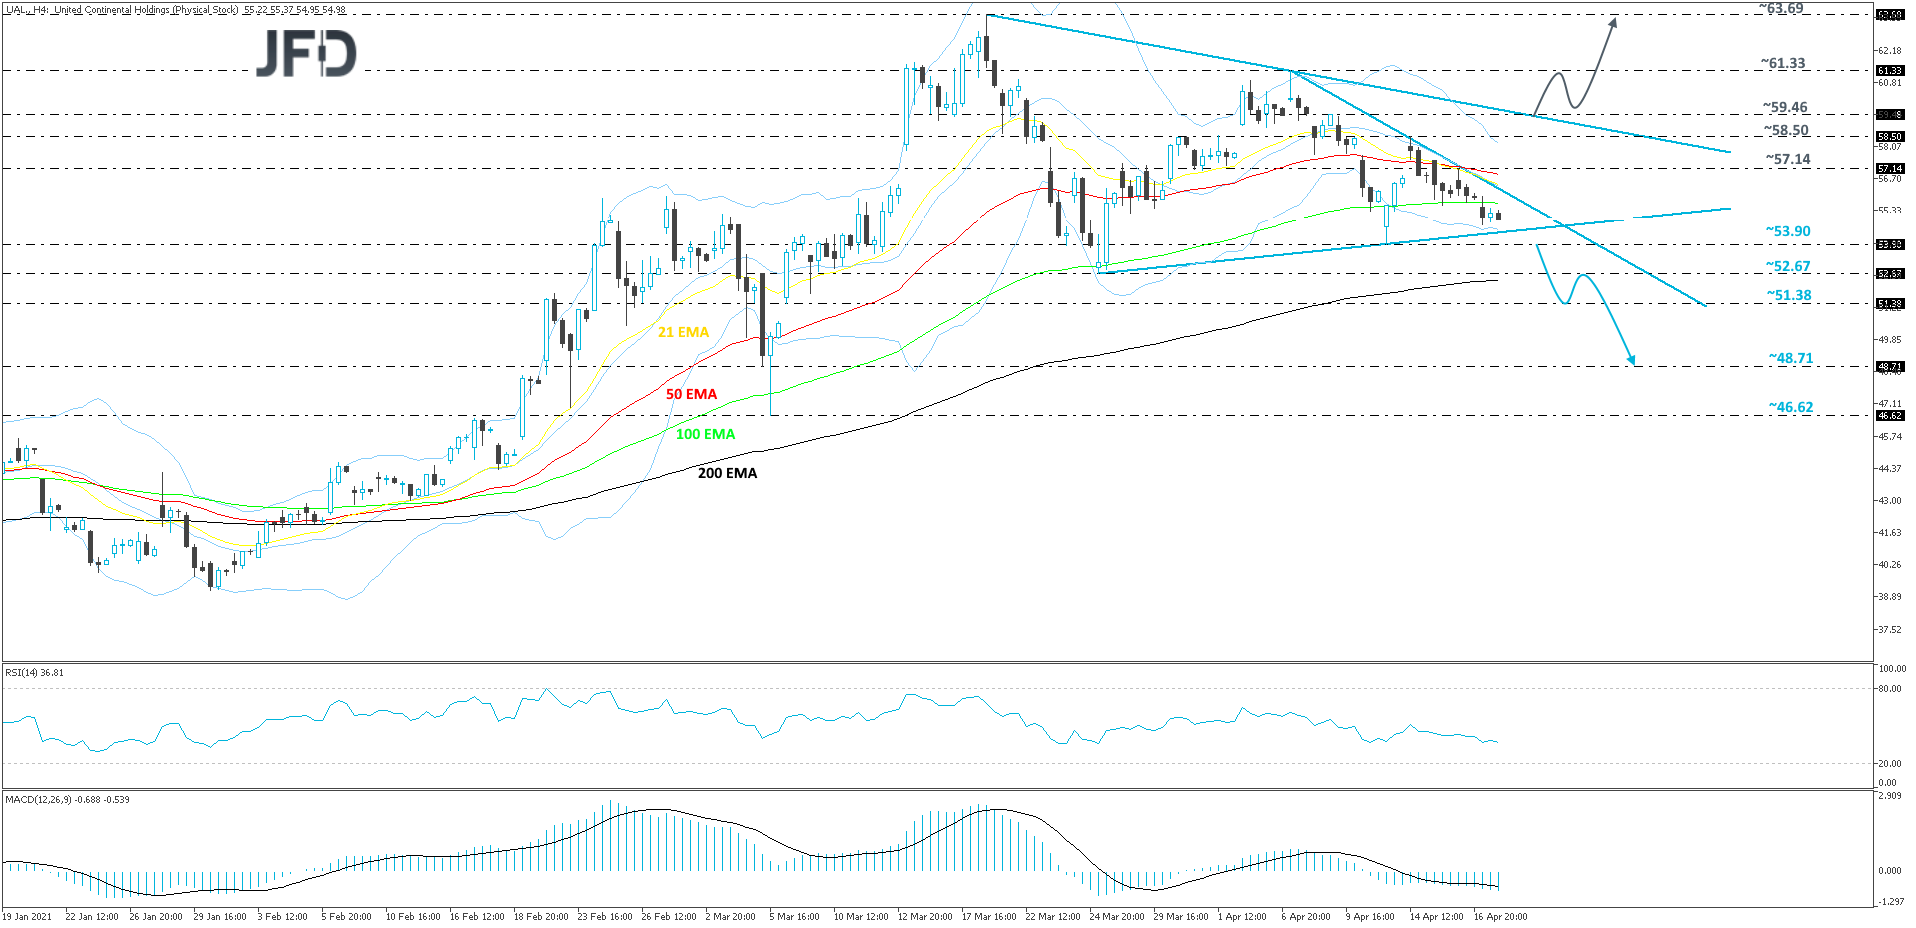
From the technical side, from around mid-March, UAL is stuck in a triangle pattern, which suggests that there is clear uncertainty among traders and investors on how to proceed further. That said, from the near-term perspective, from around the beginning of April, the stock is trading below a short-term downside line, drawn from the high of April 7th. Although there is a slight indication for a possible decline in the near-term, we would still prefer to wait for a break below the lower side of the above-mentioned triangle pattern first.
If, eventually, the stock breaks out of the triangle pattern through the lower side of it and also falls below the current lowest point of April, at 53.90, this will confirm a forthcoming lower low. Such a move may spook new buyers from entering for a while. This could result in a possible move to the 52.67 obstacle, or to the 51.38 hurdle, marked by the low of March 8th. Initially, UAL might stall there for a bit, but if there are still no new buyers in sight, the slide could continue, where the next potential target may be at 48.71.
The RSI and the MACD on our 4-hour chart are both pointing lower. Additionally, the RSI is below 50 and the MACD is below zero and its trigger line. The two oscillators support the idea of seeing further declines, at least in the near term.
Alternatively, in order to start examining the upside again, a break above the upper bound of the aforementioned triangle would be needed. Also, to strengthen the upside scenario, a push above the 59.46 barrier, marked by the high of April 8th, would be needed, as such a move might invite more buyers into the game. UAL may rise to the current highest point of April, at 61.33, a break of which might set the stage for a push towards the current highest point of this year, at 63.69.

Disclaimer:
The content we produce does not constitute investment advice or investment recommendation (should not be considered as such) and does not in any way constitute an invitation to acquire any financial instrument or product. The Group of Companies of JFD, its affiliates, agents, directors, officers or employees are not liable for any damages that may be caused by individual comments or statements by JFD analysts and assumes no liability with respect to the completeness and correctness of the content presented. The investor is solely responsible for the risk of his investment decisions. Accordingly, you should seek, if you consider appropriate, relevant independent professional advice on the investment considered. The analyses and comments presented do not include any consideration of your personal investment objectives, financial circumstances or needs. The content has not been prepared in accordance with the legal requirements for financial analyses and must therefore be viewed by the reader as marketing information. JFD prohibits the duplication or publication without explicit approval.
There are risks involved with trading of cash equities. Past performance is not indicative of future results. You should consider whether you can tolerate such losses before trading. Please read the full Risk Disclosure.
Copyright 2021 JFD Group Ltd.


 Marcus Klebe


 JFD Research
