CFD Trading
Stocks
ETFs
Trading Platforms
Payment Methods
Fraudulent websites posing to have a connection with JFD
Please be aware of fraudulent websites
posing as JFD's affiliates and/or counterparties

Equities continued to pull back yesterday and today in Asia, perhaps as rising inflation expectations continued to push bond yields higher. Today, the item on the agenda which could attract some special attention may be the minutes from the latest ECB policy gathering. We will scan the minutes to see whether Lagarde’s view over “less pronounced” downside risks is shared among other officials as well.
The US dollar continued trading higher against the majority of the other G10 currencies on Wednesday and during the Asian morning Thursday. It gained the most versus CHF, EUR, and NOK in that order, while it was found virtually unchanged against AUD and JPY.
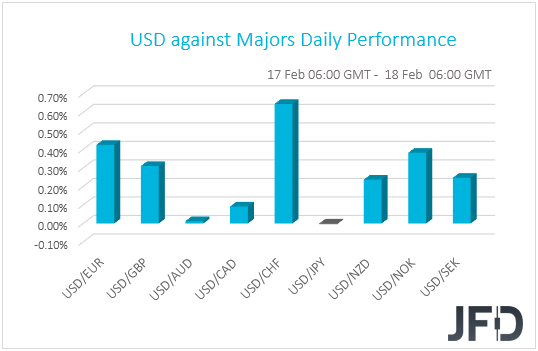
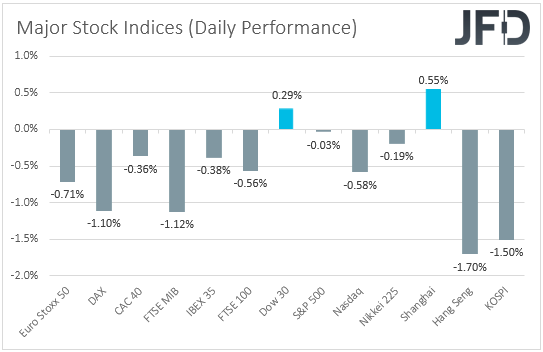
The strengthening of the US dollar and the Japanese yen suggest that markets continued trading in a risk-off manner yesterday and today in Asia. However, the weakening of the Swiss franc and the strengthening of the Aussie point otherwise. Thus, in order to get a clearer picture with regards to the broader market sentiment, we prefer to turn our gaze to the equity world. There, major EU indices were a sea of red, while in the US, Nasdaq fell 0.58%. The S&P 500 finished virtually unchanged, while the Dow Jones gained 0.29%. In Asia, sentiment was soft again, with Japan’s Nikkei 225, Hong Kong’s Hang Seng, and South Korea’s KOSPI falling 0.19%, 1.70% and 1.50% respectively. The exception was China’s Shanghai Composite, which gained 0.55% on its first trading day after the Lunar New Year celebrations.
Equities continued to pull back, perhaps as rising inflation expectations continued to push bond yields higher, with the benchmark 10-year US Treasury yield hitting its highest in a year yesterday. This means that the reflation trade could prove to be positive for equities but only to the point where the rise in bond yields is considered too fast, which could raise speculation over monetary-policy tapering by major central banks. However, we believe that it is too early for something like that and the minutes from the latest FOMC meeting add credence to our view. Yes, officials noted that PCE prices – their favorite inflation metric – were projected to move briefly above 2% in the second quarter of 2021, but this would prove to be temporary and eventually inflation is expected to finish the year at just below 2%. Inflation was projected to moderate overshoot 2% for some time in the years beyond 2023, but with monetary policy assumed to remain accommodative. Thus, with no signs of tapering any time soon, we believe that equities have the potential to rebound again, and safe havens to come under renewed selling interest.
Today, the item on the agenda which could attract some special attention may be the minutes from the latest ECB policy gathering. Despite the lockdown measures around the Eurozone, at the press conference following that decision, President Lagarde said that the downside risks to the economic outlook are now “less pronounced”, making investors skeptical over further easing, although the Bank repeated once again that it stands ready to adjust all of its instruments as appropriate. Therefore, we will scan the minutes to see whether Lagarde’s view is shared among other officials as well, and whether indeed the chances for more easing have lessened for now. Something like that may benefit somewhat the euro.
After finding resistance near the 30717 barrier on Tuesday, Nikkei 225 started correcting lower. That said, the downmove might get halted, if the short-term tentative upside line, drawn from the low of January 31st, continues to provide support. For now, we will take a cautiously-bullish approach.
As mentioned above, if the aforementioned upside line remains intact, the bulls may take advantage of the lower price and lift it up again. That’ when we will target yesterday’s high, at 30585, or the 30717 barrier, marked by the current highest point of this week. Initially, Nikkei 225 might stall there for a bit, or even correct back down again. However, if the index stays above the previously-mentioned upside line, another push higher could be possible. If this time the bulls are able to overcome the 30717 hurdle, the next possible target could be at 31371, marked by the highest point of August 1990.
On the other hand, if the aforementioned upside line breaks and the index also falls below the 29660 zone, marked by the high of February 12th, that may open the door for further declines. Nikkei 225 may then slide to the low of February 10th, at 29177, a break of which could set the stage for a move to the 28720 level. That level is marked near the high of February 3rd and by an intraday swing low of February 5th.
![]()
EUR/JPY drifted to the downside yesterday, after finding resistance near the 128.45 barrier. The pair is in slight consolidation this morning; however, it may continue its journey south for a bit more. That said, as long as the rate remains above a short-term upside support line, drawn from the low of January 18th, this move lower might be seen as a temporary correction only.
If the rate drifts below the 127.31 zone, marked by yesterday’s low, that could send the pair towards its next potential support area, near the 126.98 hurdle, marked by the low of February 12th. Around there, the pair may also find support from the aforementioned upside line. EUR/JPY might get picked up by the bulls there, and if so, it could travel back up to the 127.31 obstacle, or even the 127.68 hurdle, marked by an intraday swing low of February 15th. If the buying doesn’t stop there, the next potential target might be at 127.97, or at 128.45, which is the current highest point of February.
Alternatively, if the previously-mentioned upside line breaks and the pair falls below the 126.70 hurdle, marked by the low of February 11th, that could also place the rate below the 200 EMA on our 4-hour chart. This may be seen as a bearish indication and more sellers could join in. EUR/JPY might then drift to the 126.43 obstacle, a break of which may clear the path to the 126.10 level. That level is marked by the current lowest point of February.
![]()
The US building permits and housing starts for January are coming out, and they are both expected to have declined somewhat from their December readings. We also get the initial jobless claims for last week, with the forecast pointing to a small decline, to 765k from 793k the week before.
With regards to the energy market, we get the EIA (Energy Information Administration) report on crude oil inventories for last week, with the forecast pointing to a 2.429mn barrels decline following a 6.644mn fall the week before. Yesterday, the API reported a 5.800mn barrels slide and thus, we would consider the risks surrounding the EIA forecast as tilted to the downside. Combined with the ongoing deep freeze in Texas, this is likely to boost oil prices even further.
Tonight, during the Asian morning Friday, Japan’s National CPIs for January are due to be released. There is no forecast available for the headline rate, while the core one is anticipated to have risen to -0.7% yoy from -1.0%.
As for the speakers, we have four on today’s schedule: Atlanta Fed President Raphael Bostic, Fed Board Governor Lael Brainard, BoE MPC member Michael Saunders, and ECB Executive Board member Isabel Schnabel.
Disclaimer:
The content we produce does not constitute investment advice or investment recommendation (should not be considered as such) and does not in any way constitute an invitation to acquire any financial instrument or product. The Group of Companies of JFD, its affiliates, agents, directors, officers or employees are not liable for any damages that may be caused by individual comments or statements by JFD analysts and assumes no liability with respect to the completeness and correctness of the content presented. The investor is solely responsible for the risk of his investment decisions. Accordingly, you should seek, if you consider appropriate, relevant independent professional advice on the investment considered. The analyses and comments presented do not include any consideration of your personal investment objectives, financial circumstances or needs. The content has not been prepared in accordance with the legal requirements for financial analyses and must therefore be viewed by the reader as marketing information. JFD prohibits the duplication or publication without explicit approval.
CFDs are complex instruments and come with a high risk of losing money rapidly due to leverage. 79.07% of retail investor accounts lose money when trading CFDs with the Company. You should consider whether you understand how CFDs work and whether you can afford to take the high risk of losing your money. Please read the full Risk Disclosure.
Copyright 2021 JFD Group Ltd.

 Marcus Klebe
 Marcus Klebe
 Marcus Klebe
 Marcus Klebe
 Marcus Klebe
 JFD Research
 JFD Research
 Marcus Klebe
 Marcus Klebe
 Marcus Klebe
Fraudulent websites posing to have a connection with JFD
Please be informed that, the below listed websites fraudulently misrepresent to have a connection with JFD and have infringed with JFD’s rights and trademarks in order to defraud users of their personal data, registration data and funds.
Unfortunately, JFD cannot guarantee that the list is exhaustive or always up-to-date and refers only to the websites that were brought to our attention. Therefore, if an investor is in doubt about the connection of any website with JFD, or spots a website that is substantially similar in design, structure and content to JFD’s website, please contact us at support@jfdbrokers.com and we will take all necessary actions to report it and protect other investors from being defrauded.
For your further reference and the avoidance of any doubts, feel free to check the full list of JFD’s web domains approved by CySEC.

