CFD Trading
Stocks
ETFs
Trading Platforms
Payment Methods
Fraudulent websites posing to have a connection with JFD
Please be aware of fraudulent websites
posing as JFD's affiliates and/or counterparties

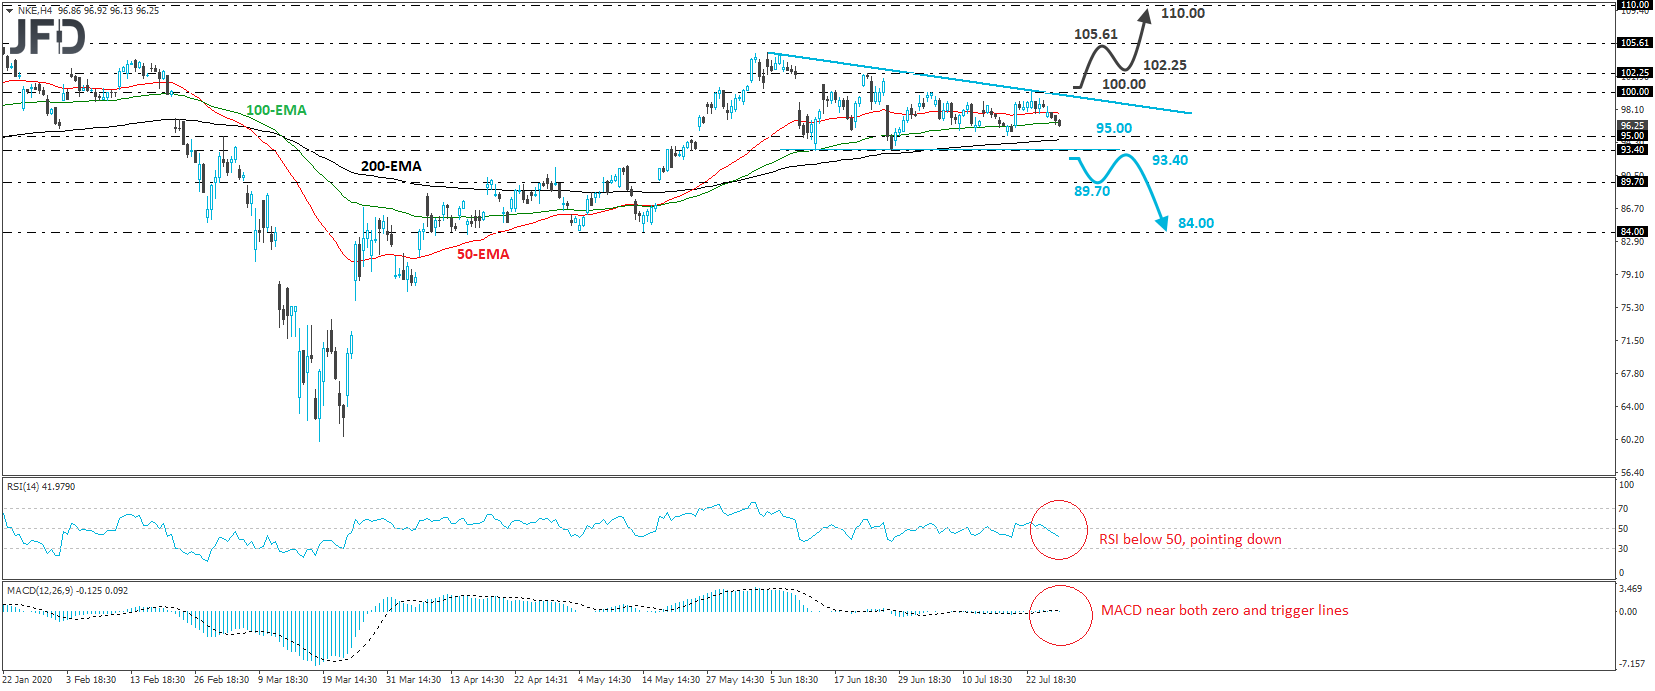
Nike Inc. (NYSE: NKE) traded lower on Monday and Tuesday, after it hit resistance at the psychological zone of 100.00 last Thursday. Overall, the stock looks to be trading in a consolidative manner, within a descending triangle formation since June 5th, and thus, we would consider the short-term outlook to be negative for now.
In order to start examining whether the stock could correct lower, we would like to see a decisive dip below the 93.40 level, which provided support on June 15th and 26th. Such a move would confirm a forthcoming lower low on both the 4-hour and daily charts and may initially pave the way towards the low of May 18th, at around 89.70. If that level is not able to stop the slide either, then we may see extensions towards the 84 barrier, which acted as a strong support zone between April 7th and May 14th.
Shifting attention to our short-term momentum studies, we see that the RSI lies below 50 and points down, but the MACD has been running flat, near both its zero and trigger lines. Although the RSI detect negative speed, the MACD points to a flat momentum, which adds to our choice of waiting for a dip below 93.40 before we start examining the bearish case.
On the upside, a break above the round number of 100.00 could also signal the upside exit out of the triangle. This may initially pave the way towards the 102.25 zone, the break of which could set the stage for the stock’s all-time high, at 105.61. If the bulls are willing to drive Nike into unchartered territory, the next resistance to consider may be the psychological barrier of 110.00.
Disclaimer:
The content we produce does not constitute investment advice or investment recommendation (should not be considered as such) and does not in any way constitute an invitation to acquire any financial instrument or product. The Group of Companies of JFD, its affiliates, agents, directors, officers or employees are not liable for any damages that may be caused by individual comments or statements by JFD analysts and assumes no liability with respect to the completeness and correctness of the content presented. The investor is solely responsible for the risk of his investment decisions. Accordingly, you should seek, if you consider appropriate, relevant independent professional advice on the investment considered. The analyses and comments presented do not include any consideration of your personal investment objectives, financial circumstances or needs. The content has not been prepared in accordance with the legal requirements for financial analyses and must therefore be viewed by the reader as marketing information. JFD prohibits the duplication or publication without explicit approval.
There are risks involved with trading of cash equities. Past performance is not indicative of future results. You should consider whether you can tolerate such losses before trading. Please read the full Risk Disclosure.
Copyright 2020 JFD Group Ltd.

 Marcus Klebe
 Marcus Klebe
 Marcus Klebe
 Marcus Klebe
 Marcus Klebe
 JFD Research
 JFD Research
 Marcus Klebe
 Marcus Klebe
 Marcus Klebe
Fraudulent websites posing to have a connection with JFD
Please be informed that, the below listed websites fraudulently misrepresent to have a connection with JFD and have infringed with JFD’s rights and trademarks in order to defraud users of their personal data, registration data and funds.
Unfortunately, JFD cannot guarantee that the list is exhaustive or always up-to-date and refers only to the websites that were brought to our attention. Therefore, if an investor is in doubt about the connection of any website with JFD, or spots a website that is substantially similar in design, structure and content to JFD’s website, please contact us at support@jfdbrokers.com and we will take all necessary actions to report it and protect other investors from being defrauded.
For your further reference and the avoidance of any doubts, feel free to check the full list of JFD’s web domains approved by CySEC.

