CFD Trading
Stocks
ETFs
Trading Platforms
Payment Methods
Fraudulent websites posing to have a connection with JFD
Please be aware of fraudulent websites
posing as JFD's affiliates and/or counterparties

European equities traded lower yesterday, but Wall Street finished in the green ahead of tomorrow’s FOMC decision, where the Committee is forecast to lift rates by 50bps. Overnight, during the Asian session today, we already had a major central bank deciding on interest rates and this was the RBA. This Bank lifted rates by 25bps, at a time when the consensus was for a 15bps increase. The result was a rebound in the Aussie.
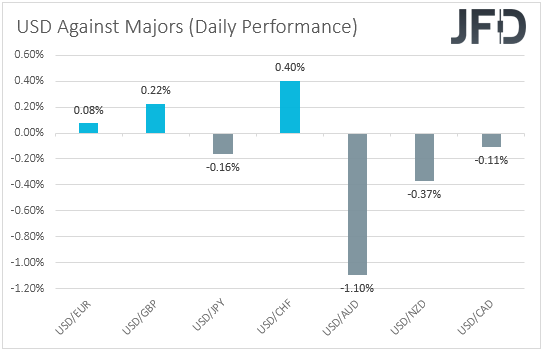
The US dollar traded mixed against the other major currencies on Monday and during the Asian session Tuesday. It gained versus CHF, GBP, and EUR in that order, while it underperformed against AUD, NZD, JPY, and CAD.
The strengthening of the risk- and commodity-linked Aussie and Kiwi, combined with the weakening of the Swiss franc, suggests that markets may have traded in a risk-on fashion. However, the fact that the yen managed to even gain somewhat, makes us skeptical on that front. Thus, in order to get a clearer picture with regards to the broader market sentiment, we prefer to turn our gaze to the equity world.
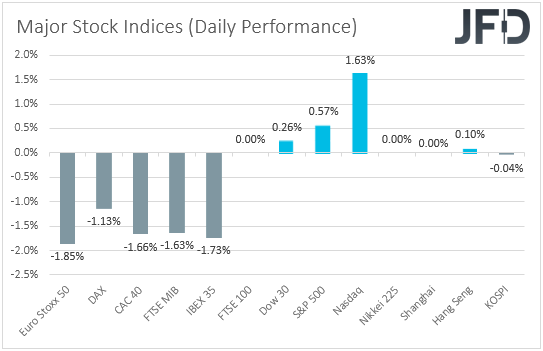
There, we see that the major EU indices under our radar that were open yesterday fell by more than 1% each, but this may have been the result of a brief crash in Nordic markets, caused by a single sell order trade by Citigroup Inc. During the US session, appetite improved, with Nasdaq gaining the most (1.63%). Today in Asia, Japan’s Nikkei 225 and China’s Shanghai Composite stayed closed due to holidays, while Hong Kong’s Hang Seng and South Korea’s KOSPI stayed near their opening levels.
Despite the recovery in US indices, and especially Nasdaq, we are reluctant to change our view, especially with the US Fed decision looming tomorrow. The Committee is widely expected to hike by 50bps and thus, if indeed this is the case, all the attention is likely to fall to hints and clues with regards to its future course of action. Anything confirming the aggressive expectations over multiple more sizable rate increments in the months to come could refuel the USD uptrend and perhaps bring equities under selling interest. We repeat for the umpteenth time that higher interest rates mean higher borrowing costs for companies, as well as lower present values, especially for high-growth firms, which are valued based on discounted expected cash flows for the months and years ahead. The opposite could be true in case the Committee fails to satisfy current expectations.
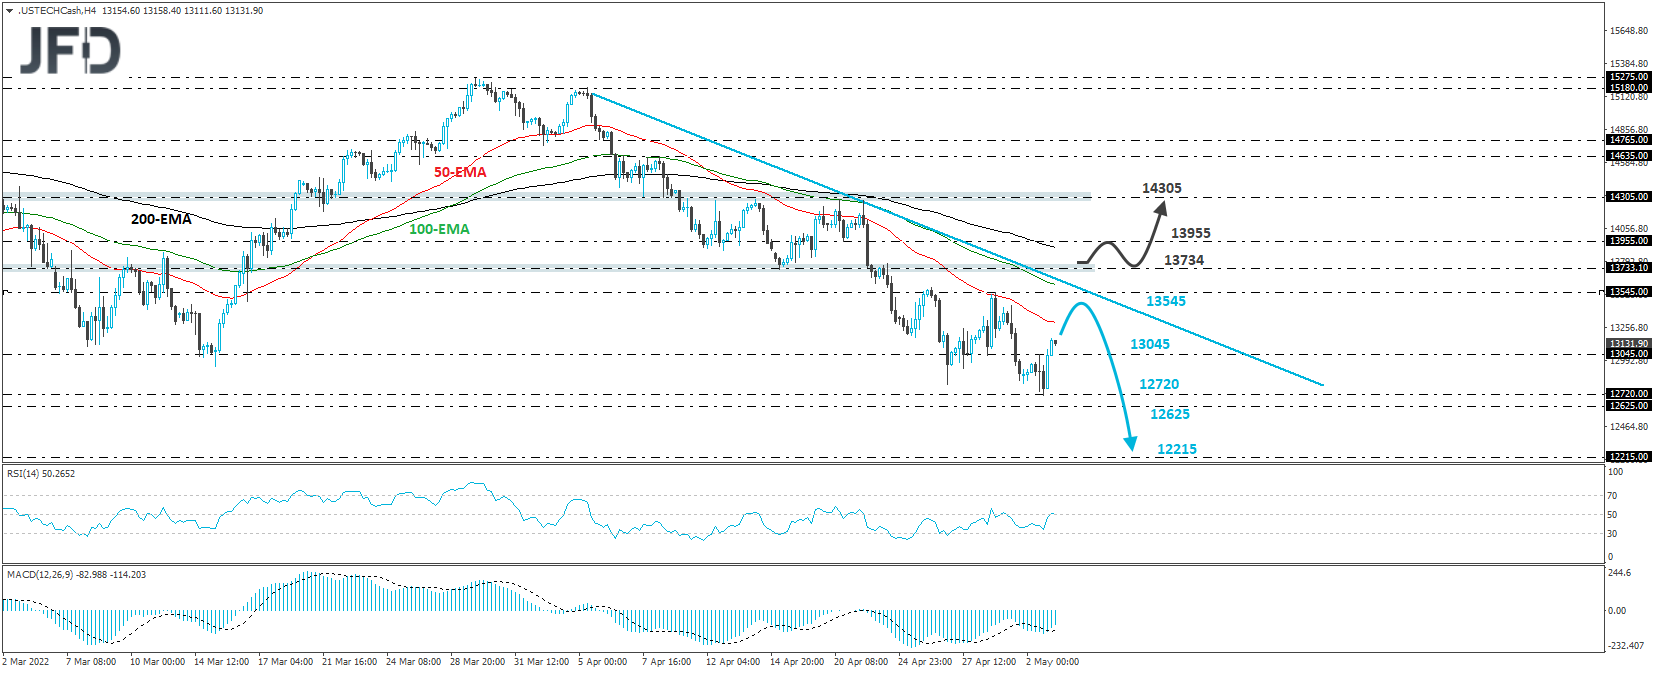
The Nasdaq 100 cash index traded higher yesterday, after it hit support near the 12720 zone. Although the index moved back above the 13045 barrier, it stays below the downside resistance line drawn from the high of April 5th. Thus, we still see a negative short-term outlook.
Even if the recovery continues for a while more, we see decent chances for the bears to jump back into the action from near the 13545 zone, which provided resistance on April 26th and 28th. This could result in a forthcoming slide and another test near the 12720 zone, or the 12625 barrier, marked by the low of March 25th, 2021. If the bears are not willing to stop there either, then we may see them pushing towards the low of March 5th, 2021, at 12215.
On the upside, we would like to see a recovery above 13734 before we abandon the bullish case. This may confirm the break above the downside line taken from the high of April 5th, and could initially aim for the 13955 barrier, marked by the inside swing low of April 20th. Another break, above 13955, could extend the advance towards the 14305 territory, which acted as a temporary ceiling between April 12th and 21st.
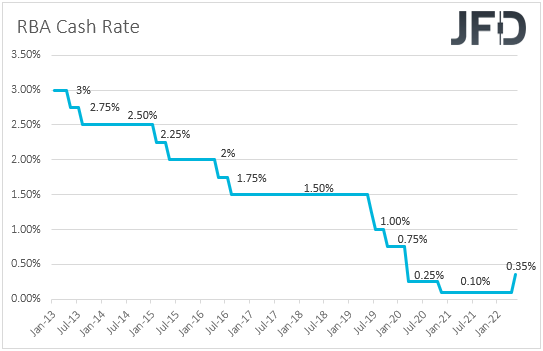
Today, during the Asian morning, we already had a major central bank deciding on interest rates and this was the RBA. The Bank decided to hike by 25bps, to 0.35% from 0.10%, surprising the financial community, which was expecting a 15bps increase, and sending the Aussie higher against every other of its major peers. The Bank committed to doing what is necessary to ensure that inflation returns to target over time, and explicitly said that this will require a further lift in interest rate over the period ahead.
This added some credence to the overly hawkish market expectations around this Bank’s future course of action, but officials have yet to confirm how fast they are willing to proceed. In any case, the Aussie may continue to benefit against currencies the central banks of which are staying ultra-dovish, like the BoJ, and perhaps even against central banks which are planning to normalize at a slower pace, like the ECB. In other words, we do see the case for AUD/JPY to drift further north, and for EUR/AUD to extend its overnight slide, and perhaps break below the upside support line drawn from the low of April 5th.
Having said all that though, we don’t see the case for a trend reversal in AUD/USD. Yes, a lot will depend on tomorrow’s FOMC outcome, but from what we know at the moment, the Fed is ready to proceed with double and triple hikes in the months to come, much more aggressive than the RBA’s quarter-point hike. Thus, we stick to our guns that, barring any major surprises tomorrow, the path of least resistance for AUD/USD may stay to the downside.
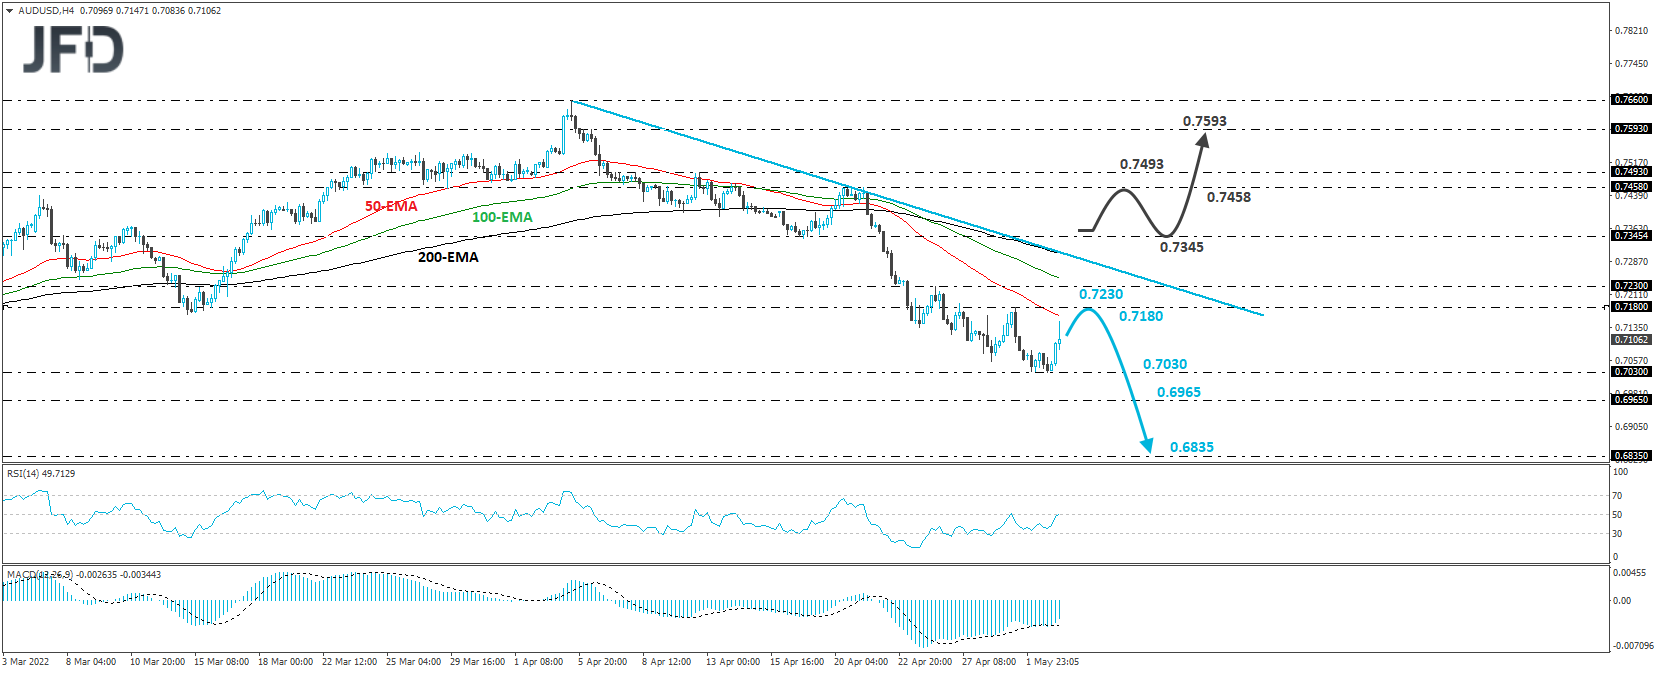
AUD/USD traded higher in the aftermath of the RBA decision, after hitting support at 0.7030. However, the price structure on the 4-hour chart still points to a downtrend below the downside line drawn from the high of April 5th. Therefore, we will consider the short-term outlook to still be negative, even if the current recovery continues for a while more.
This could result in a test near the 0.7180 zone, marked by the high of April 29th, or even at 0.7230, the high of April 26th. The bears could recharge from there and perhaps push for another test near 0.7030. A break lower would confirm a forthcoming lower low and may pave the way towards the low of January 28th, at 0.6965. If the sellers are not willing to stop there, then we may see them diving all the way down to the 0.6835 zone, marked by the low of June 30th.
We will start examining the bullish case only if we see a break above 0.7345, marked by the low of April 18th. The rate will already be above the aforementioned downside line and may initially pave the way towards the 0.7458 zone, marked by the high of April 21st. Slightly higher lies the high of April 12th, at 0.7493, the break of which could see scope for extensions towards the high of April 6th, at 0.7593.
The only data releases worth mentioning for the rest of Tuesday are the German unemployment rate for April, the UK’s final manufacturing PMI for the same month, and the US’s JOLTs job openings for March.
Tonight, during the Asian session, we do have New Zealand’s employment report for Q1. The unemployment rate is expected to have stayed unchanged at 3.2%, and the net employment change to show that the economy has continued to add jobs at the same slow pace as in Q4 last year. The Labor Cost Index though is expected to have risen further, to 3.1% yoy from 2.8%, which could add to speculation of further acceleration in inflation, and thereby revive some speculation over more rate hikes by the RBNZ. Remember that at its latest gathering, the RBNZ lifted rates by 50bps, but hinted that it hiked more now so it can slow down later.
Disclaimer:
The content we produce does not constitute investment advice or investment recommendation (should not be considered as such) and does not in any way constitute an invitation to acquire any financial instrument or product. The Group of Companies of JFD, its affiliates, agents, directors, officers or employees are not liable for any damages that may be caused by individual comments or statements by JFD analysts and assumes no liability with respect to the completeness and correctness of the content presented. The investor is solely responsible for the risk of his investment decisions. Accordingly, you should seek, if you consider appropriate, relevant independent professional advice on the investment considered. The analyses and comments presented do not include any consideration of your personal investment objectives, financial circumstances or needs. The content has not been prepared in accordance with the legal requirements for financial analyses and must therefore be viewed by the reader as marketing information. JFD prohibits the duplication or publication without explicit approval.
CFDs are complex instruments and come with a high risk of losing money rapidly due to leverage. 73.82% of retail investor accounts lose money when trading CFDs with the Company. You should consider whether you understand how CFDs work and whether you can afford to take the high risk of losing your money. Please read the full Risk Disclosure.
Copyright 2022 JFD Group Ltd.

 Marcus Klebe
 Marcus Klebe
 Marcus Klebe
 Marcus Klebe
 Marcus Klebe
 JFD Research
 JFD Research
 Marcus Klebe
 Marcus Klebe
 Marcus Klebe
Fraudulent websites posing to have a connection with JFD
Please be informed that, the below listed websites fraudulently misrepresent to have a connection with JFD and have infringed with JFD’s rights and trademarks in order to defraud users of their personal data, registration data and funds.
Unfortunately, JFD cannot guarantee that the list is exhaustive or always up-to-date and refers only to the websites that were brought to our attention. Therefore, if an investor is in doubt about the connection of any website with JFD, or spots a website that is substantially similar in design, structure and content to JFD’s website, please contact us at support@jfdbrokers.com and we will take all necessary actions to report it and protect other investors from being defrauded.
For your further reference and the avoidance of any doubts, feel free to check the full list of JFD’s web domains approved by CySEC.

