Fraudulent websites posing to have a connection with JFD
Please be aware of fraudulent websites
posing as JFD's affiliates and/or counterparties

Is Total SA Stock Forming A Bullish Flag?
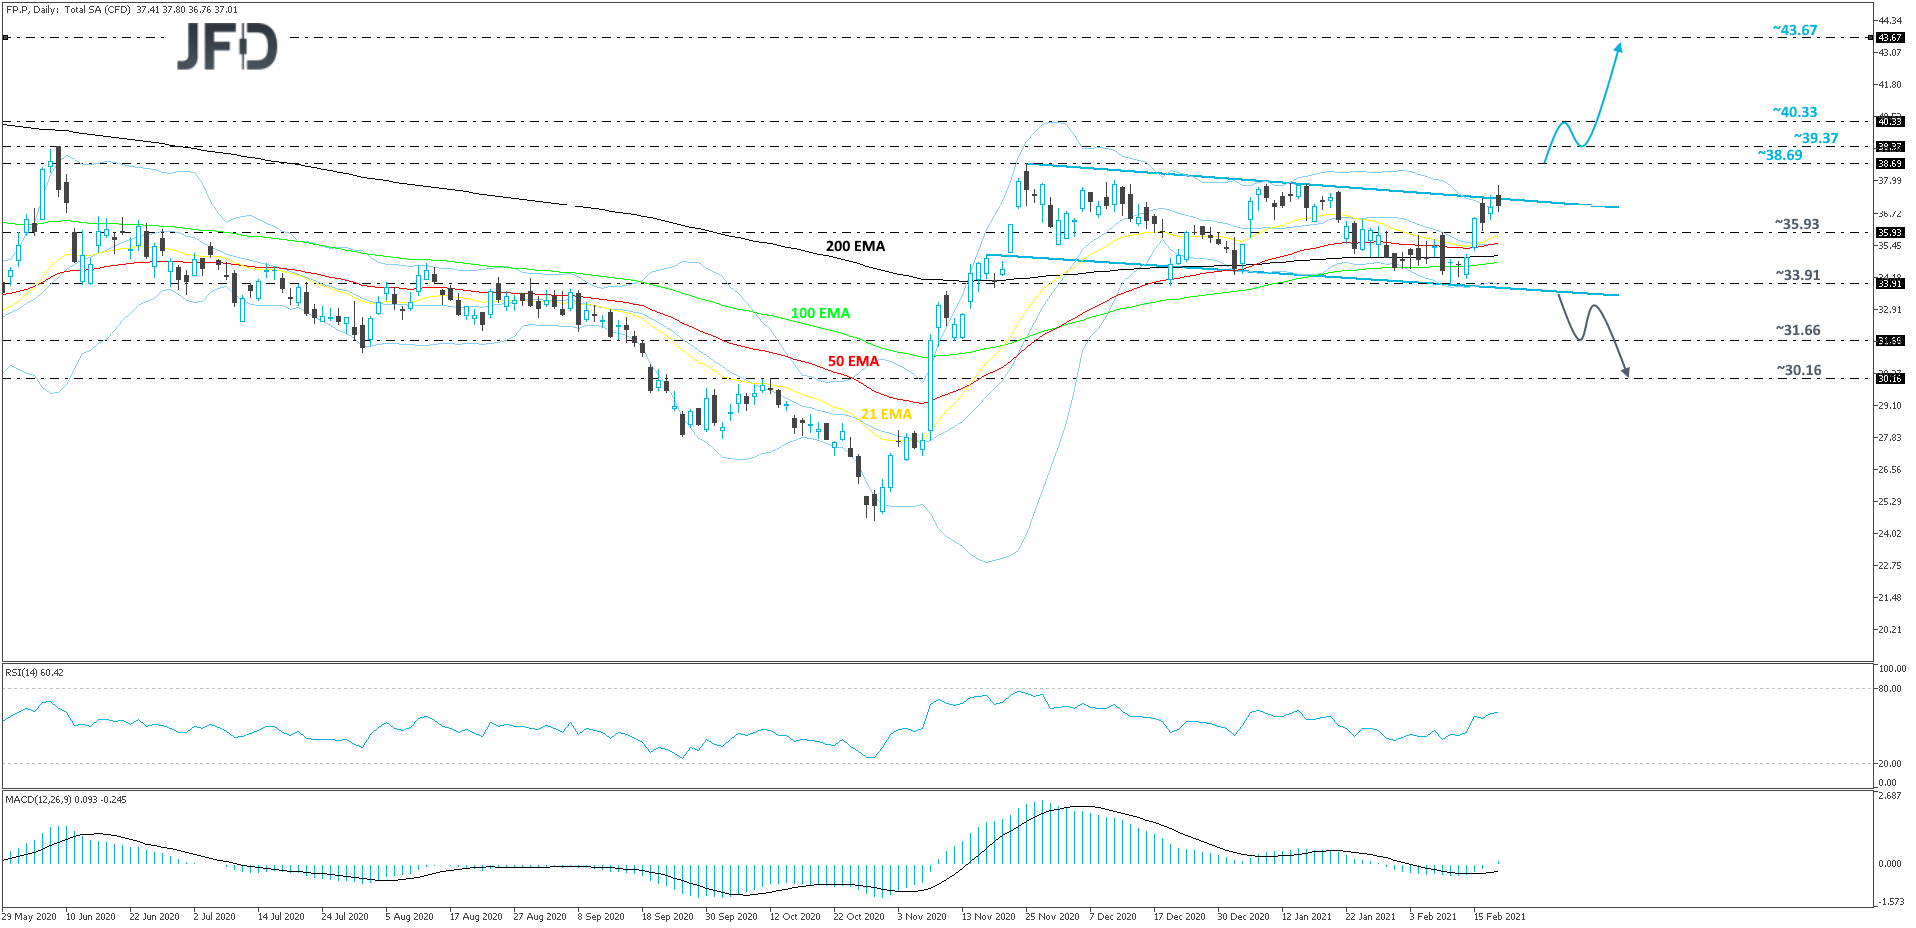
The technical picture of the Total SA stock (EPA: FP) on our daily chart shows that from around the end of November, the share price is moving withing a channel, slightly tilted to the downside. However, on a slightly bigger picture, the channel could be considered as a possible bullish flag pattern. But before we could get comfortable in exploring that idea, we would like to wait for a violation of the highest point of November, at 38.69. Until then, we will take a cautiously-bullish approach.
If the share price moves above the upper bound of the aforementioned channel and then also climbs above the 38.69 barrier, marked by the highest point of November, that would confirm a forthcoming higher high, possibly opening the door to further advances. More new buyers could see this as a good opportunity to step in and drive the stock to the 39.37 obstacle, or the 40.33 hurdle, marked by the highest point of March 2020. FP might stall somewhere around there, but if there are still enough new buyers, the stock may rise again, possibly aiming for the 43.67 level. That level marks the low of February 3rd and the high of February 24th, 2020, respectively.
The RSI and the MACD are currently pointing slightly to the upside. The RSI is above 50 and the MACD has just moved above zero, and continues to run above its trigger line. The two indicators seem to support the upside scenario, as both show rising upside price momentum.
A break below the current low of February, at 33.91, and a further drop below the lower side of the previously-discussed channel, could keep new buyers from entering for a while. FP may then travel to the 31.66 obstacle, a break of which could clear the way for a further decline to the 30.16 zone. That zone is marked by the highest point of October 2020.

Disclaimer:
The content we produce does not constitute investment advice or investment recommendation (should not be considered as such) and does not in any way constitute an invitation to acquire any financial instrument or product. The Group of Companies of JFD, its affiliates, agents, directors, officers or employees are not liable for any damages that may be caused by individual comments or statements by JFD analysts and assumes no liability with respect to the completeness and correctness of the content presented. The investor is solely responsible for the risk of his investment decisions. Accordingly, you should seek, if you consider appropriate, relevant independent professional advice on the investment considered. The analyses and comments presented do not include any consideration of your personal investment objectives, financial circumstances or needs. The content has not been prepared in accordance with the legal requirements for financial analyses and must therefore be viewed by the reader as marketing information. JFD prohibits the duplication or publication without explicit approval.
There are risks involved with trading of cash equities. Past performance is not indicative of future results. You should consider whether you can tolerate such losses before trading. Please read the full Risk Disclosure.
Copyright 2021 JFD Group Ltd.


 JFD Research


