CFD Trading
Stocks
ETFs
Trading Platforms
Payment Methods
Fraudulent websites posing to have a connection with JFD
Please be aware of fraudulent websites
posing as JFD's affiliates and/or counterparties

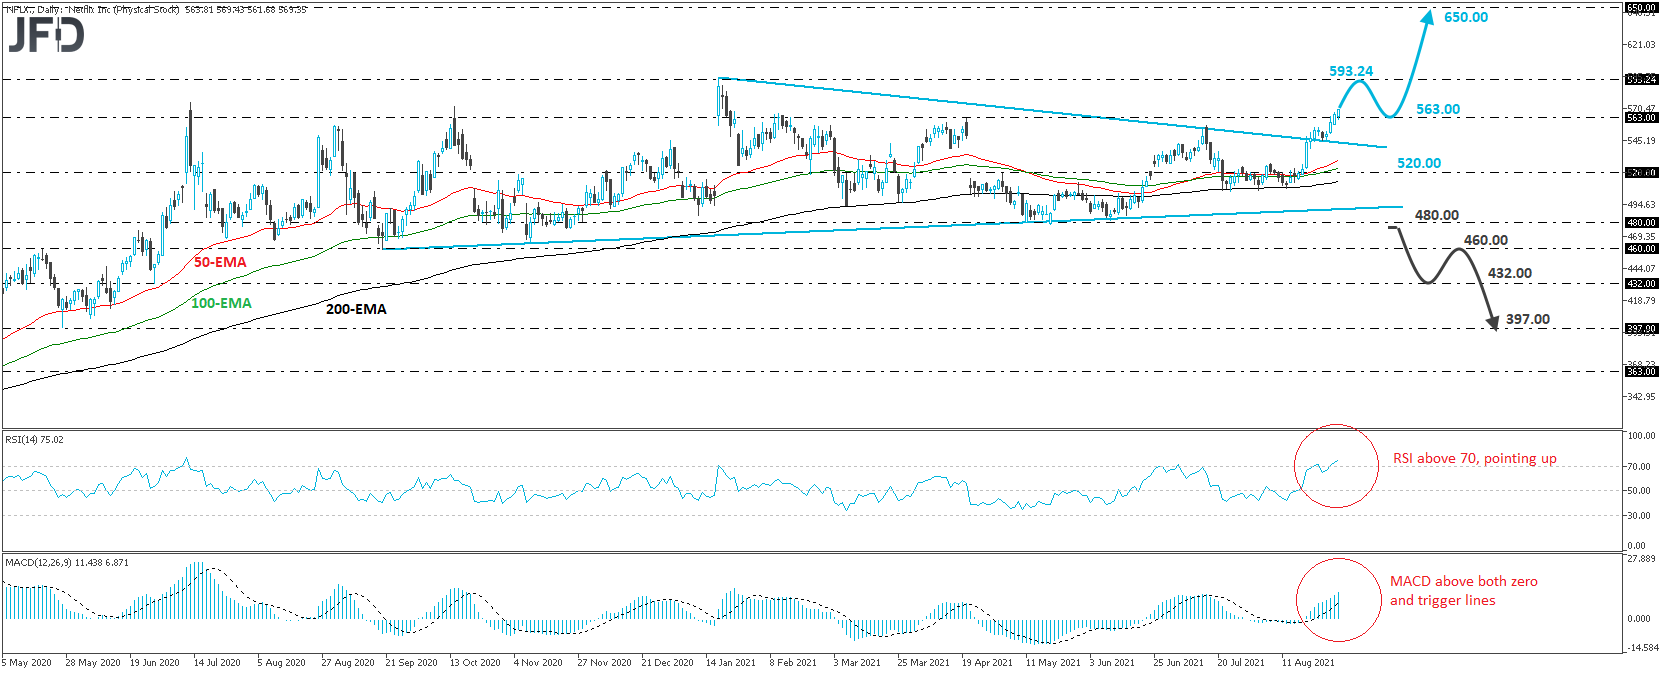
Netflix Inc (NASDAQ: NFLX) has been in in a rising mode since August 17th, while on the 23rd, it managed to break above the downside resistance line drawn from the high of January 20th. What’s more, on Monday, the stock emerged above the high of April 20th, at 563.00 a move that may have confirmed that the outlook has turned from neutral to positive.
In our view, the break above 563.00 may have opened the path towards the stocks record high of 593.24, hit on January 20th. If investors are not willing to stop there this time around, then a break higher would take the stock into the uncharted territory, and with no prior highs and inside swing lows to mark the next potential resistance zone, we would consider a one the round figure of 650.00.
Taking a look at our daily oscillators, we see that the RSI lies above 70 and points up, while the MACD runs above both its zero and trigger lines, pointing north as well. Both indicators detect strong upside momentum and corroborate the view for further advances and potentially a new record in this stock.
On the downside, we would like to see a dip below 480.00 before we start examining the bearish case. This may confirm a break below the upside support line taken from the low of September 18th, last year, and may allow declines towards 460.00, marked by that low, or the 432.00 zone, defined as a support by the low of June 29th, 2020. If investors are not willing to buy at that price either, then we could see the slide extending towards the low of May 27th, 2020, at 397.00.
Disclaimer:
The content we produce does not constitute investment advice or investment recommendation (should not be considered as such) and does not in any way constitute an invitation to acquire any financial instrument or product. The Group of Companies of JFD, its affiliates, agents, directors, officers or employees are not liable for any damages that may be caused by individual comments or statements by JFD analysts and assumes no liability with respect to the completeness and correctness of the content presented. The investor is solely responsible for the risk of his investment decisions. Accordingly, you should seek, if you consider appropriate, relevant independent professional advice on the investment considered. The analyses and comments presented do not include any consideration of your personal investment objectives, financial circumstances or needs. The content has not been prepared in accordance with the legal requirements for financial analyses and must therefore be viewed by the reader as marketing information. JFD prohibits the duplication or publication without explicit approval.
There are risks involved with trading of cash equities. Past performance is not indicative of future results. You should consider whether you can tolerate such losses before trading. Please read the full Risk Disclosure.
Copyright 2021 JFD Group Ltd.

 Marcus Klebe
 Marcus Klebe
 Marcus Klebe
 Marcus Klebe
 Marcus Klebe
 JFD Research
 JFD Research
 Marcus Klebe
 Marcus Klebe
 Marcus Klebe
Fraudulent websites posing to have a connection with JFD
Please be informed that, the below listed websites fraudulently misrepresent to have a connection with JFD and have infringed with JFD’s rights and trademarks in order to defraud users of their personal data, registration data and funds.
Unfortunately, JFD cannot guarantee that the list is exhaustive or always up-to-date and refers only to the websites that were brought to our attention. Therefore, if an investor is in doubt about the connection of any website with JFD, or spots a website that is substantially similar in design, structure and content to JFD’s website, please contact us at support@jfdbrokers.com and we will take all necessary actions to report it and protect other investors from being defrauded.
For your further reference and the avoidance of any doubts, feel free to check the full list of JFD’s web domains approved by CySEC.

