CFD Trading
Stocks
ETFs
Trading Platforms
Payment Methods
Fraudulent websites posing to have a connection with JFD
Please be aware of fraudulent websites
posing as JFD's affiliates and/or counterparties

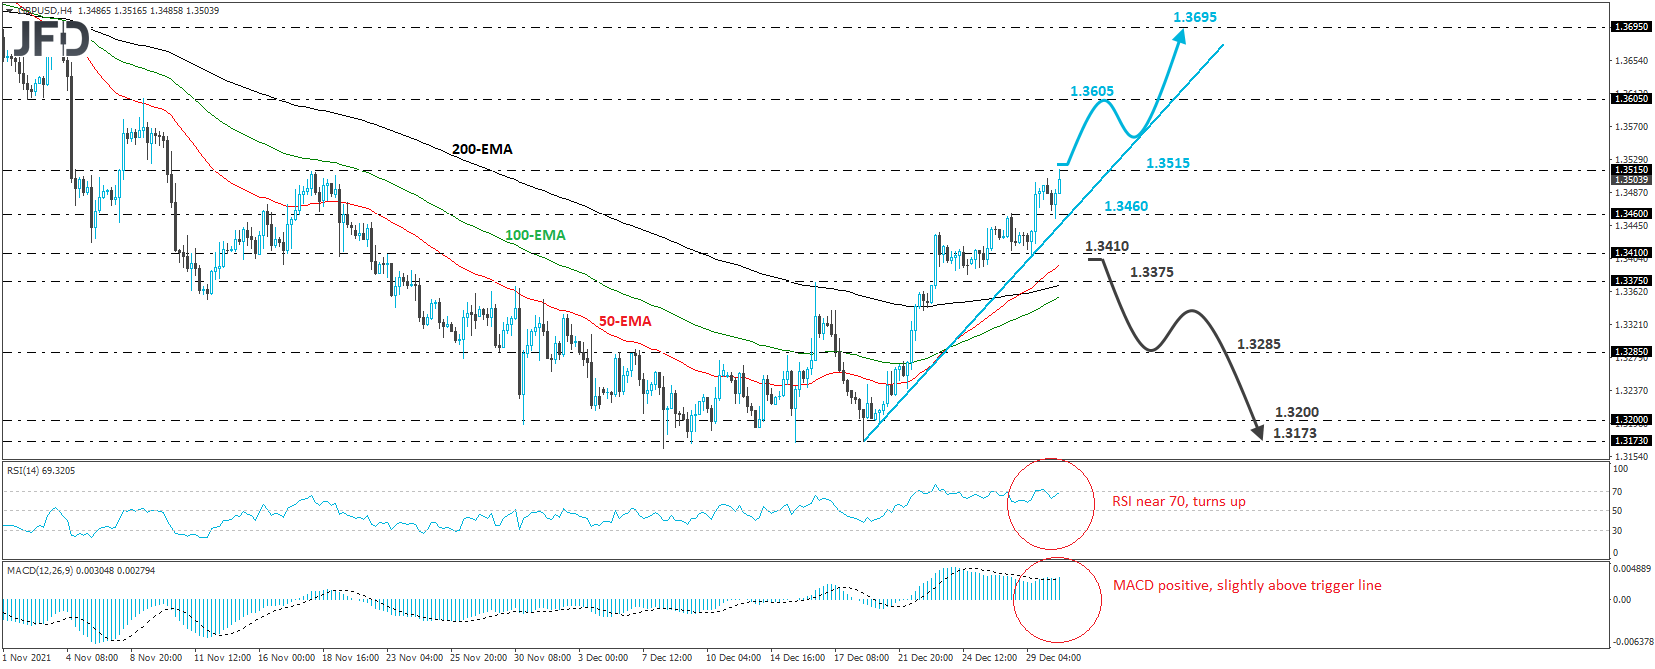
GBP/USD traded higher today, after it hit support near the 1.3460 zone, marked by the high of December 28th. Overall, the pair is trading above the upside support line drawn from the low of December 20th, and thus, we will consider the short-term outlook to be positive.
A clear and decisive break above the 1.3515 barrier, which is defined as a resistance by the high of November 18th may signal and trend continuation and perhaps pave the way towards the high of November 9th, at 1.3605. If the bulls are not willing to stop there either, then we could see them climbing towards the high of November 4th, at 1.3695.
Taking a look at our short-term oscillators, we see that the RSI is already near 70 and turned up again, while the MACD, already positive, has just crossed back above its trigger line. Both indicators detect strong upside speed and corroborate our view for further advances.
In order to start examining a bearish reversal, we would like to see a dip back below 1.3410. This could confirm the break below the upside line taken from the low of December 20th, and may initially target the 1.3375 level, defined by the inside swing high of December 16th. Another dip, below 1.3375, could carry larger bearish implications, perhaps opening the way towards the 1.3285 level, which is the inside swing high of December 16th. If the bears are not willing to stop there either, we could see them diving towards the 1.3200 or 1.3173 zone, defined as supports by the lows of December 21st and 20th respectively.
Disclaimer:
The content we produce does not constitute investment advice or investment recommendation (should not be considered as such) and does not in any way constitute an invitation to acquire any financial instrument or product. The Group of Companies of JFD, its affiliates, agents, directors, officers or employees are not liable for any damages that may be caused by individual comments or statements by JFD analysts and assumes no liability with respect to the completeness and correctness of the content presented. The investor is solely responsible for the risk of his investment decisions. Accordingly, you should seek, if you consider appropriate, relevant independent professional advice on the investment considered. The analyses and comments presented do not include any consideration of your personal investment objectives, financial circumstances or needs. The content has not been prepared in accordance with the legal requirements for financial analyses and must therefore be viewed by the reader as marketing information. JFD prohibits the duplication or publication without explicit approval.
CFDs are complex instruments and come with a high risk of losing money rapidly due to leverage. 68.02% of retail investor accounts lose money when trading CFDs with the Company. You should consider whether you understand how CFDs work and whether you can afford to take the high risk of losing your money. Please read the full Risk Disclosure.
Copyright 2021 JFD Group Ltd.

 Marcus Klebe
 Marcus Klebe
 Marcus Klebe
 Marcus Klebe
 Marcus Klebe
 JFD Research
 JFD Research
 Marcus Klebe
 Marcus Klebe
 Marcus Klebe
Fraudulent websites posing to have a connection with JFD
Please be informed that, the below listed websites fraudulently misrepresent to have a connection with JFD and have infringed with JFD’s rights and trademarks in order to defraud users of their personal data, registration data and funds.
Unfortunately, JFD cannot guarantee that the list is exhaustive or always up-to-date and refers only to the websites that were brought to our attention. Therefore, if an investor is in doubt about the connection of any website with JFD, or spots a website that is substantially similar in design, structure and content to JFD’s website, please contact us at support@jfdbrokers.com and we will take all necessary actions to report it and protect other investors from being defrauded.
For your further reference and the avoidance of any doubts, feel free to check the full list of JFD’s web domains approved by CySEC.

