CFD Trading
Stocks
ETFs
Trading Platforms
Payment Methods
Fraudulent websites posing to have a connection with JFD
Please be aware of fraudulent websites
posing as JFD's affiliates and/or counterparties

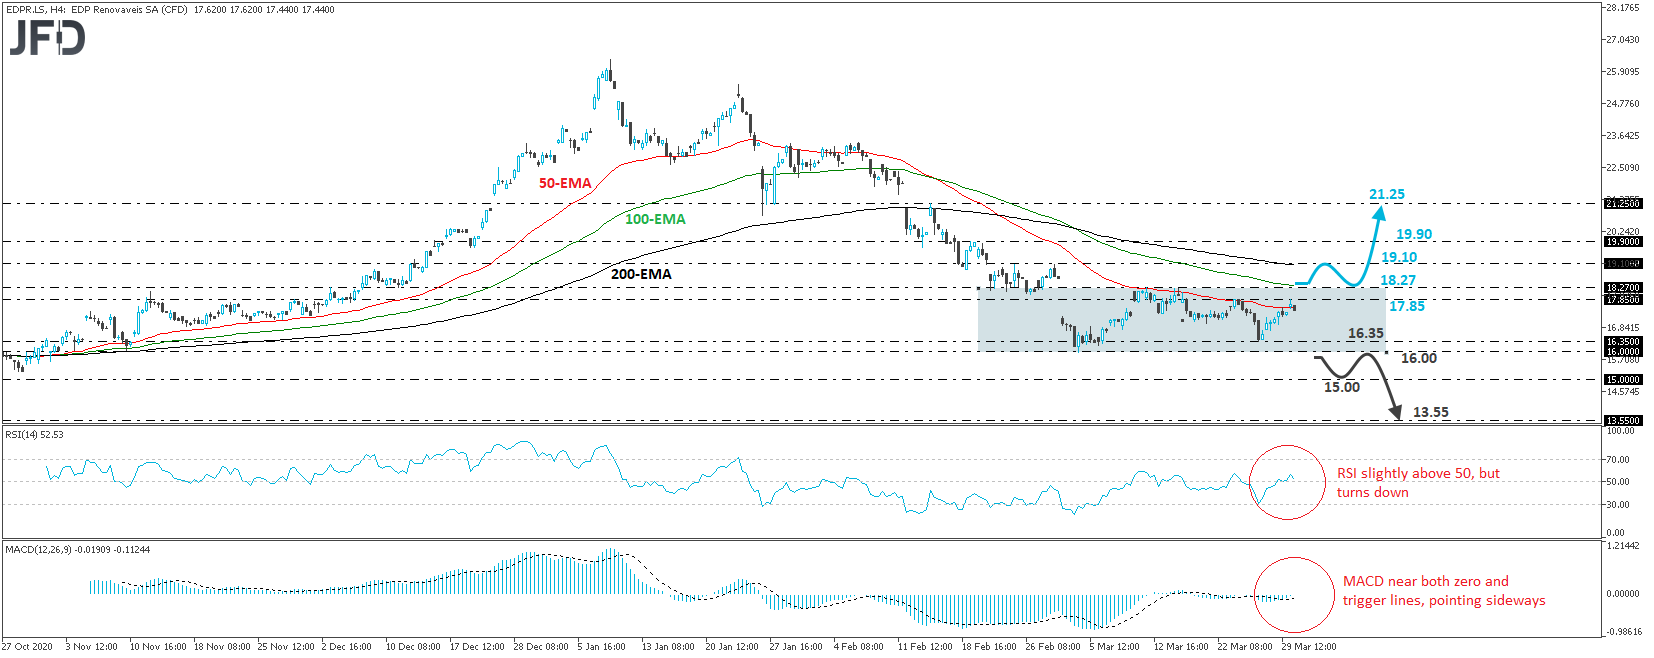
The EDP Renovaveis SA stock opened with a small positive gap today, but hit resistance at 17.85, and then, it pulled back. Overall, the stock has been trading in a sideways manner since March 2nd, between 16.00 and 18.27, and thus, we would consider the short-term outlook to be neutral for now.
In order to start examining the bullish case, we would like to see a clear break above the range’s upper bound, at 18.27. This may encourage investors to target the 19.10 barrier, marked by the highs of February 25nd and March 2nd, or the peak of February 19th, at around 19.90. If that hurdle is broken as well, then we may see more bullish extensions, perhaps towards the high of February 16th, at 21.25.
Turning our gaze to the short-term oscillators, we see that the RSI, although slightly above 50, has turned down again, while the MACD lies near both its zero and trigger lines, pointing east. Both indicators suggest lack of directional momentum and enhance our choice to stay on the sidelines for now.
On the downside, we would like to see a dip below 16.00 before we start examining larger declines. Such a move would confirm a forthcoming lower low on the daily chart and may initially target the psychological zone of 15.00, which is also marked by the inside swing high of September 2nd. If that zone is not able to halt the slide, then we could see extensions towards the low of September 25th, at 13.55.
Disclaimer:
The content we produce does not constitute investment advice or investment recommendation (should not be considered as such) and does not in any way constitute an invitation to acquire any financial instrument or product. The Group of Companies of JFD, its affiliates, agents, directors, officers or employees are not liable for any damages that may be caused by individual comments or statements by JFD analysts and assumes no liability with respect to the completeness and correctness of the content presented. The investor is solely responsible for the risk of his investment decisions. Accordingly, you should seek, if you consider appropriate, relevant independent professional advice on the investment considered. The analyses and comments presented do not include any consideration of your personal investment objectives, financial circumstances or needs. The content has not been prepared in accordance with the legal requirements for financial analyses and must therefore be viewed by the reader as marketing information. JFD prohibits the duplication or publication without explicit approval.
CFDs are complex instruments and come with a high risk of losing money rapidly due to leverage. 79.07% of retail investor accounts lose money when trading CFDs with the Company. You should consider whether you understand how CFDs work and whether you can afford to take the high risk of losing your money. Please read the full Risk Disclosure.
Copyright 2021 JFD Group Ltd.

 Marcus Klebe
 Marcus Klebe
 Marcus Klebe
 Marcus Klebe
 Marcus Klebe
 JFD Research
 JFD Research
 Marcus Klebe
 Marcus Klebe
 Marcus Klebe
Fraudulent websites posing to have a connection with JFD
Please be informed that, the below listed websites fraudulently misrepresent to have a connection with JFD and have infringed with JFD’s rights and trademarks in order to defraud users of their personal data, registration data and funds.
Unfortunately, JFD cannot guarantee that the list is exhaustive or always up-to-date and refers only to the websites that were brought to our attention. Therefore, if an investor is in doubt about the connection of any website with JFD, or spots a website that is substantially similar in design, structure and content to JFD’s website, please contact us at support@jfdbrokers.com and we will take all necessary actions to report it and protect other investors from being defrauded.
For your further reference and the avoidance of any doubts, feel free to check the full list of JFD’s web domains approved by CySEC.

