CFD Trading
Stocks
ETFs
Trading Platforms
Payment Methods
Fraudulent websites posing to have a connection with JFD
Please be aware of fraudulent websites
posing as JFD's affiliates and/or counterparties

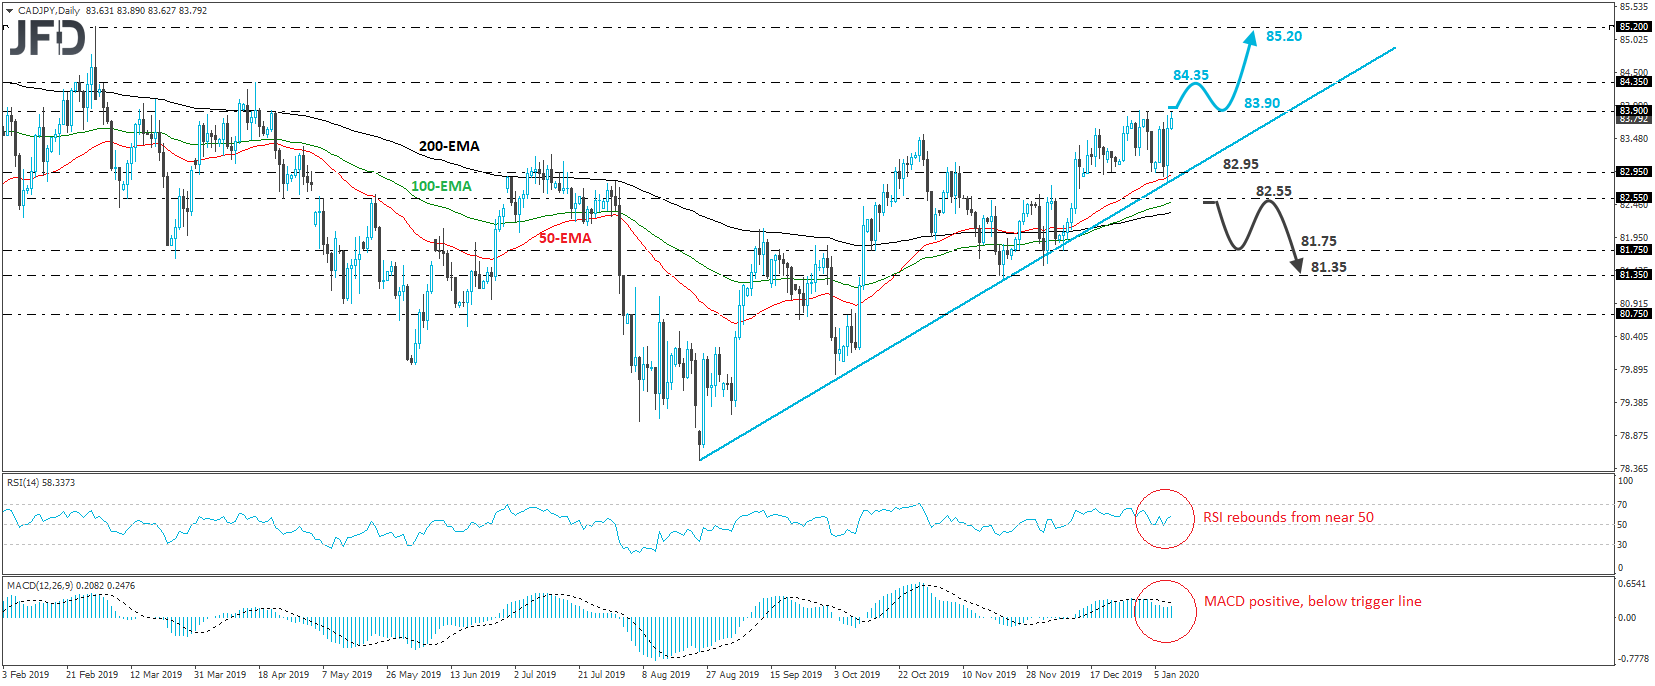
CAD/JPY traded higher yesterday, after it hit support near the upside line drawn from the low of August 25th. The rebound continued today as well, but the rate was stopped near the 83.90 barrier, which provided resistance on December 31st and January 2nd. As long as the rate trades above the aforementioned line, we would consider the medium-term outlook to be positive.
However, we would like to see a decisive break above 83.90 before we get confident on a trend continuation. Such a move would confirm a forthcoming higher high on the daily chart and may initially aim for the peak of April 17th, at around 84.35. If the bulls are not willing to stop there, then a break higher could see scope for more upside extensions, perhaps towards the 85.20 zone, defined as a resistance by the high of March 1st.
Looking at our daily oscillators, we see that the RSI rebounded from near its 50 barrier, while the MACD lies within its positive zone, below its trigger line, but shows signs of bottoming. It could cross back above its trigger soon. These indicators suggest that CAD/JPY has started gaining back upside speed, and support the notion for the bulls to stay in charge.
On the downside, we would like to see a clear dip below the 82.55 territory, before we start examining the case of a reversal. This would bring the rate below the pre-mentioned upside support line drawn from the low of August 25th, and may encourage the bears to push towards the low of December 9th, at around 81.75. If they manage to overcome that hurdle as well, then we could see them targeting the 81.35 area, near the lows of November 20th and 21st.
Disclaimer:
The content we produce does not constitute investment advice or investment recommendation (should not be considered as such) and does not in any way constitute an invitation to acquire any financial instrument or product. The Group of Companies of JFD, its affiliates, agents, directors, officers or employees are not liable for any damages that may be caused by individual comments or statements by JFD analysts and assumes no liability with respect to the completeness and correctness of the content presented. The investor is solely responsible for the risk of his investment decisions. Accordingly, you should seek, if you consider appropriate, relevant independent professional advice on the investment considered. The analyses and comments presented do not include any consideration of your personal investment objectives, financial circumstances or needs. The content has not been prepared in accordance with the legal requirements for financial analyses and must therefore be viewed by the reader as marketing information. JFD prohibits the duplication or publication without explicit approval.
CFDs are complex instruments and come with a high risk of losing money rapidly due to leverage. 78% of retail investor accounts lose money when trading CFDs with the Company. You should consider whether you understand how CFDs work and whether you can afford to take the high risk of losing your money. Please read the full Risk Disclosure.
Copyright 2020 JFD Group Ltd.

 Marcus Klebe
 Marcus Klebe
 Marcus Klebe
 Marcus Klebe
 Marcus Klebe
 JFD Research
 JFD Research
 Marcus Klebe
 Marcus Klebe
 Marcus Klebe
Fraudulent websites posing to have a connection with JFD
Please be informed that, the below listed websites fraudulently misrepresent to have a connection with JFD and have infringed with JFD’s rights and trademarks in order to defraud users of their personal data, registration data and funds.
Unfortunately, JFD cannot guarantee that the list is exhaustive or always up-to-date and refers only to the websites that were brought to our attention. Therefore, if an investor is in doubt about the connection of any website with JFD, or spots a website that is substantially similar in design, structure and content to JFD’s website, please contact us at support@jfdbrokers.com and we will take all necessary actions to report it and protect other investors from being defrauded.
For your further reference and the avoidance of any doubts, feel free to check the full list of JFD’s web domains approved by CySEC.

