CFD Trading
Stocks
ETFs
Trading Platforms
Payment Methods
Fraudulent websites posing to have a connection with JFD
Please be aware of fraudulent websites
posing as JFD's affiliates and/or counterparties

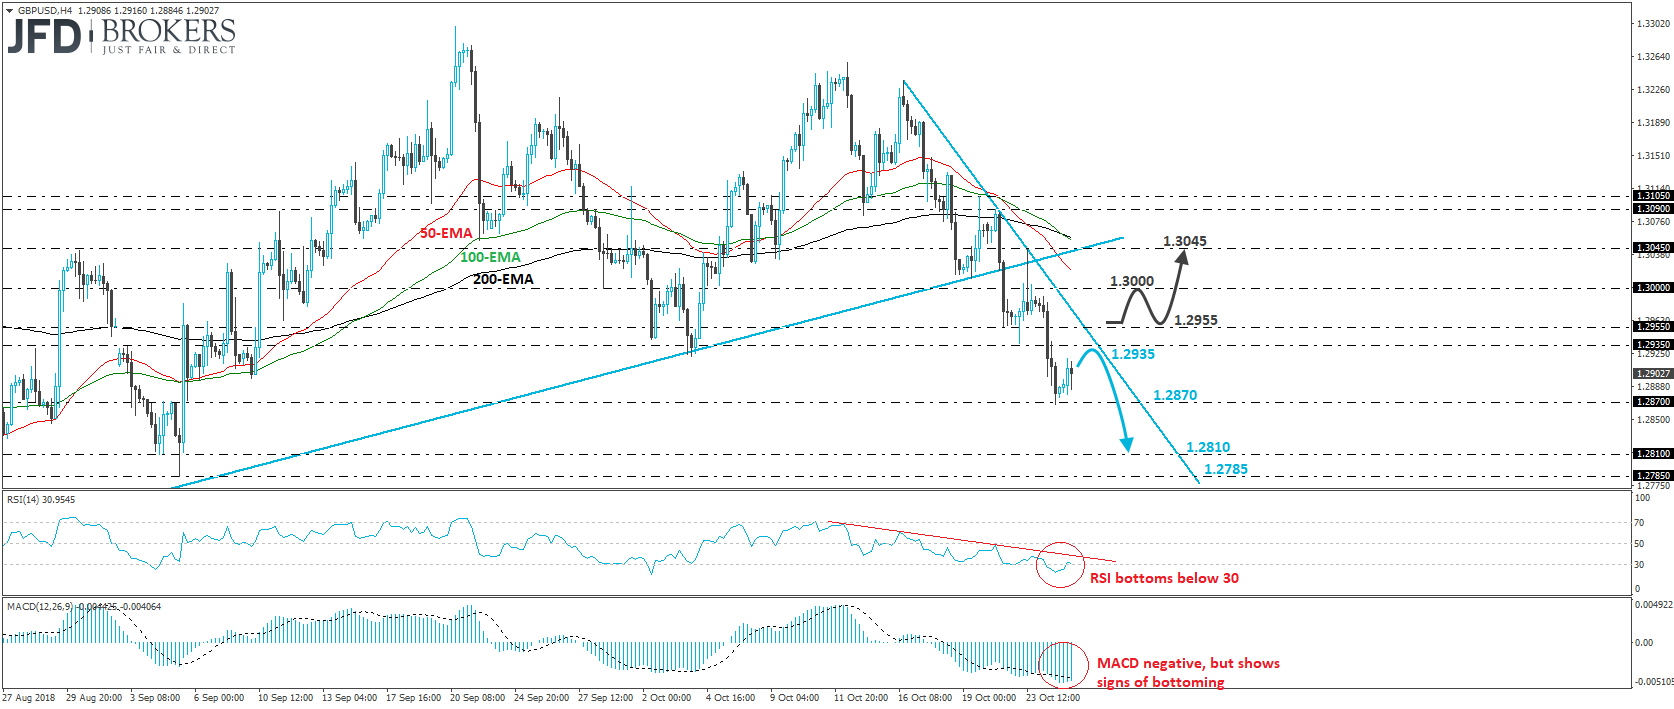
GBP/USD tumbled yesterday, breaking below the support (now turned into resistance) barrier of 1.2935, marked by Tuesday’s low. That said, the pair hit support near 1.2870, and then rebounded somewhat. On the 4-hour chart, the price structure remains of lower peaks and lower troughs below the short-term downtrend line taken from the peak of the 16th of October, as well as below the prior upside support line drawn from the low of the 15th of August. Therefore, we would consider the near-term outlook to still be negative.
We would expect the bears to take charge again soon and aim for another test near the 1.2870 territory. If they prove strong enough to overcome that area this time, then we may see them driving the battle towards our next support of 1.2810, or the 1.2785 level, defined by the low of the 5th of September.
Shifting attention to our short-term momentum studies, we see that the RSI bottomed within its below-30 zone and just poked its nose above 30, while the MACD, although below both its zero and trigger lines, shows signs of bottoming as well. These indicators suggest that some more recovery may be in the works before the next negative leg, perhaps for the rate to test the aforementioned short-term downtrend line, or the 1.2935 barrier as a resistance this time.
In order to start examining whether the short-term outlook has shifted to somewhat positive, we would like to see a decisive move above 1.2955. Such a move could confirm the break of the downtrend line and may initially pave the way for the psychological round figure of 1.3000. Another break above 1.3000 could carry more bullish extensions, perhaps towards Tuesday’s peak of 1.3045.
The content we produce does not constitute investment advice or investment recommendation (should not be considered as such) and does not in any way constitute an invitation to acquire any financial instrument or product. JFD Brokers, its affiliates, agents, directors, officers or employees are not liable for any damages that may be caused by individual comments or statements by JFD Brokers analysts and assumes no liability with respect to the completeness and correctness of the content presented. The investor is solely responsible for the risk of his investment decisions. Accordingly, you should seek, if you consider appropriate, relevant independent professional advice on the investment considered. The analyzes and comments presented do not include any consideration of your personal investment objectives, financial circumstances or needs. The content has not been prepared in accordance with the legal requirements for financial analyzes and must therefore be viewed by the reader as marketing information. JFD Brokers prohibits the duplication or publication without explicit approval.
CFDs are complex instruments and come with a high risk of losing money rapidly due to leverage. 75% of retail investor accounts lose money when trading CFDs with the Company. You should consider whether you understand how CFDs work and whether you can afford to take the high risk of losing your money. Please read the full Risk Disclosure.

 Marcus Klebe
 Marcus Klebe
 Marcus Klebe
 Marcus Klebe
 Marcus Klebe
 JFD Research
 JFD Research
 Marcus Klebe
 Marcus Klebe
 Marcus Klebe
Fraudulent websites posing to have a connection with JFD
Please be informed that, the below listed websites fraudulently misrepresent to have a connection with JFD and have infringed with JFD’s rights and trademarks in order to defraud users of their personal data, registration data and funds.
Unfortunately, JFD cannot guarantee that the list is exhaustive or always up-to-date and refers only to the websites that were brought to our attention. Therefore, if an investor is in doubt about the connection of any website with JFD, or spots a website that is substantially similar in design, structure and content to JFD’s website, please contact us at support@jfdbrokers.com and we will take all necessary actions to report it and protect other investors from being defrauded.
For your further reference and the avoidance of any doubts, feel free to check the full list of JFD’s web domains approved by CySEC.

