CFD Trading
Stocks
ETFs
Trading Platforms
Payment Methods
Fraudulent websites posing to have a connection with JFD
Please be aware of fraudulent websites
posing as JFD's affiliates and/or counterparties

Major EU indices traded in the red yesterday, and although Wall Street’s S&P 500 and Nasdaq gained, sentiment deteriorated again in Asia today. This may have been due to market chatter that the coronavirus variants are now more infectious and dangerous, as well as due to concerns over the timing and size of additional fiscal stimulus in the US.
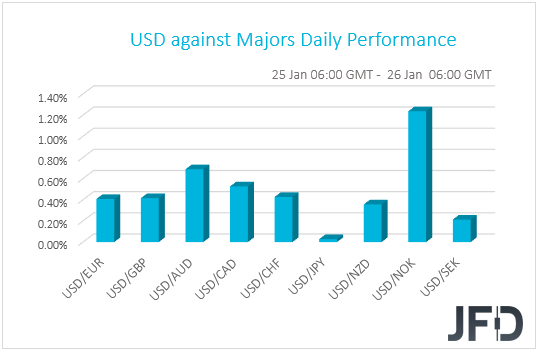
The US dollar traded higher against all but one of the other G10 currencies on Monday and during the Asian session Tuesday. It most outperformed NOK, AUD, CAD and CHF in that order, while it eked out the least gains against SEK and NZD. The greenback was found virtually unchanged versus JPY.
The strengthening of the US dollar and the Japanese yen, combined with the weakness in the commodity-linked Aussie and Loonie, suggests that markets turned risk-off yesterday and today in Asia. Indeed, turning our gaze to the equity world, we see that major EU indices were a sea of red, perhaps on market chatter that variants of the coronavirus are more infectious and more dangerous. On Sunday, the UK health minister said that 77 cases of the South African variant were detected in Britain, while in France, there were talks of a third lockdown. On top of that, the German Ifo survey showed that the nation’s business morale fell by more than anticipated in January as the second wave of covid infections may have slowed down Eurozone’s growth engine.
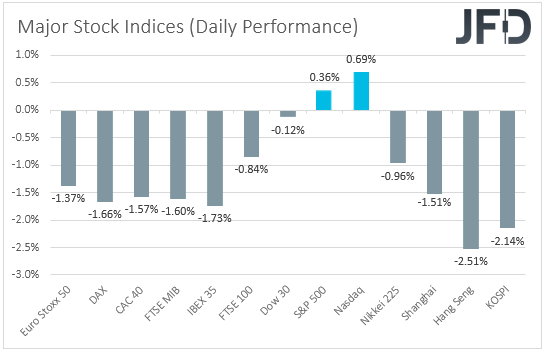
In the US, the Dow Jones slid 0.12%, while the S&P 500 and Nasdaq rose 0.36% and 0.69%, hitting fresh closing records after US President Joe Biden revealed his plan to boost manufacturing through government purchases. Nasdaq was the main winner amid gains in the so-called “stay at home” stocks, like Microsoft, Facebook and Apple, which have been in a rising mode following upbeat earnings results from Netflix last week. That said, investors’ appetite deteriorated again during the Asian trading today, perhaps due to concerns over the timing and size of additional fiscal stimulus in the US, as Republicans seemed skeptical over Biden’s USD 1.9trln proposal, noting that it is too expensive.
Following the latest rally in equities, with US indices continuously hitting fresh record highs, a profit-taking period appears more than normal to us, especially taking into account the aforementioned concerns. However, all this doesn’t mean that the vaccinations of the covid will not succeed, neither that any fiscal package in the US will not help the economy. Maybe some excitement on that front is already priced in, but we think that the uncertainty over what lies ahead is now much less than it was back in March. Eventually, we see the case for a large percentage of the global population being vaccinated, and, with central banks keeping their foot on the extra-loose pedal, economies around the globe may recover. With regards to the fiscal aid in the US, we believe that a Democratic-controlled Congress will make it easier for Biden to pass his agenda.
Looking at the technical picture of Nikkei 225 on our 4-hour chart, we can see that, so far, it continues to trade above a short-term tentative upside support line drawn from the low of December 21st. However, from around mid-January, the index seems to be getting squeezed, as it trades inside a small triangle formation. Our oscillators, the RSI and the MACD, are currently pointing a bit to the downside, suggesting there could be a slight decline in the near term. Even if the index breaks through the lower side of that triangle, we would still remain somewhat bullish, if the above-mentioned upside line stays intact.
A drop through the lower side of the triangle and a break below the 28406 hurdle, marked by the low of January 22nd, could send Nikkei 225 to the 28101 zone, marked by the low of January 18th. Around there, the price may test the aforementioned upside line, which if holds, might act as a good support area, from which the index could rebound. If so, a move back to the 28474 hurdle, which is yesterday’s low, may be possible. If the buying doesn’t stop there, the next possible target might be at 28856, marked by the yesterday’s high.
Alternatively, if the previously-discussed upside line breaks and the price falls below the 27956 hurdle, marked by the lows of January 11th and 12th respectively, that may invite more sellers into the game, as the direction of the short-term trend could be changed. Nikkei 225 may then travel to the 27697 obstacle, or to the 27619 zone, marked by an intraday swing high of January 7th. Around there, the price might also test the 200 EMA. If the slide continues, the next possible aim might be at 27292, which marks an intraday swing low of January 6th.
![]()
After yesterday’s reversal to the upside, USD/CHF is now seen pushing higher, while trading above a short-term tentative upside support line taken from the low of January 6th. The pair is once again trading near the 200 EMA. From the very short-term perspective, there is a good chance to see a bit more upside, as our oscillators are pointing higher.
The RSI is showing increasing upside price momentum, which supports the idea of seeing a move towards slightly higher areas in the near term. A break above the 0.8893 barrier will confirm a forthcoming higher high, potentially setting the stage for a further upmove. We will then aim for the 0.8920 obstacle, or even the 0.8926 hurdle, marked by the highs of January 20th and 17th respectively. If the buying doesn’t end there, the next possible target might be at 0.8946, which is the high of December 7th.
On the other hand, if the rate suddenly falls below the aforementioned upside line and then slides below the 0.8847 hurdle, marked by yesterday’s low, that could invite more sellers into the game. USD/CHF may then drift to the low of last week, at 0.8838, a break of which would confirm a forthcoming lower low and send the pair to the 0.8822 zone, marked by the low of January 8th. The rate could stall there for a bit, however, if the sellers are still in control, the next possible target might be the 0.8798 level, marked by an intraday swing high of January 6th.
![]()
During the early European morning, we already got the UK employment report for November. The unemployment rate rose by less than anticipated, while the net change in employment showed that the economy lost less jobs than projected. On top of that, average weekly earnings, both including and excluding bonuses, accelerated more than forecast. Overall, the report was better than expected, but not enough to diminish chances for the BoE to expand its QE purchases if deemed necessary.
Having said all that though, we stick to our guns that, overall, with the Brexit saga now taking the back seat, and BoE Governor playing down the prospect of negative interest rates, the pound has the potential to perform relatively well, at least against the safe havens, like the dollar and the yen, which we expect to come under renewed selling interest soon due to a supported overall market sentiment.
Later in the day, from the US, we get the Conference Board consumer confidence index for January, which is expected to have risen fractionally, to 89.0 from 88.6. The API (American Petroleum Institute) report on crude oil inventories for last week is also coming out, but as it is always the case, no forecast is available.
Tonight, during the Asian session Wednesday, we have Australia’s CPIs for Q4. Both the headline and trimmed mean yoy rates are expected to have held steady at +0.7% and 1.2% respectively. Although both rates are well below the lower end of the RBA’s target range of 2-3%, unchanged inflation is unlikely to increase speculation for further easing by this Bank. After all, at its latest meeting, it noted that the Australian economic recovery is underway, and that recent data have generally been better than expected. In order for officials to be tempted to add to their stimulative efforts, we believe that a disappointment may be needed.
Disclaimer:
The content we produce does not constitute investment advice or investment recommendation (should not be considered as such) and does not in any way constitute an invitation to acquire any financial instrument or product. The Group of Companies of JFD, its affiliates, agents, directors, officers or employees are not liable for any damages that may be caused by individual comments or statements by JFD analysts and assumes no liability with respect to the completeness and correctness of the content presented. The investor is solely responsible for the risk of his investment decisions. Accordingly, you should seek, if you consider appropriate, relevant independent professional advice on the investment considered. The analyses and comments presented do not include any consideration of your personal investment objectives, financial circumstances or needs. The content has not been prepared in accordance with the legal requirements for financial analyses and must therefore be viewed by the reader as marketing information. JFD prohibits the duplication or publication without explicit approval.
CFDs are complex instruments and come with a high risk of losing money rapidly due to leverage. 72.57% of retail investor accounts lose money when trading CFDs with the Company. You should consider whether you understand how CFDs work and whether you can afford to take the high risk of losing your money. Please read the full Risk Disclosure.
Copyright 2021 JFD Group Ltd.

 Marcus Klebe
 Marcus Klebe
 Marcus Klebe
 Marcus Klebe
 Marcus Klebe
 JFD Research
 JFD Research
 Marcus Klebe
 Marcus Klebe
 Marcus Klebe
Fraudulent websites posing to have a connection with JFD
Please be informed that, the below listed websites fraudulently misrepresent to have a connection with JFD and have infringed with JFD’s rights and trademarks in order to defraud users of their personal data, registration data and funds.
Unfortunately, JFD cannot guarantee that the list is exhaustive or always up-to-date and refers only to the websites that were brought to our attention. Therefore, if an investor is in doubt about the connection of any website with JFD, or spots a website that is substantially similar in design, structure and content to JFD’s website, please contact us at support@jfdbrokers.com and we will take all necessary actions to report it and protect other investors from being defrauded.
For your further reference and the avoidance of any doubts, feel free to check the full list of JFD’s web domains approved by CySEC.

